OPEN-SOURCE SCRIPT
已更新 Daily Weekly Monthly Yearly Opens
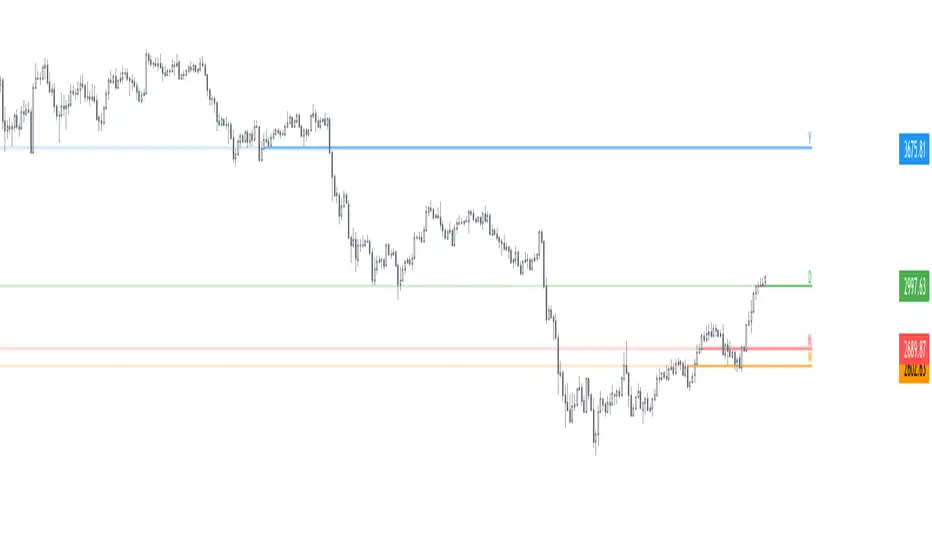
This script plots the current daily, weekly and monthly opens (all enabled by default).
Here are some additional info about the drawing behavior:
Here are some additional info about the drawing behavior:
- Daily open is shown only on intraday timeframes
- Weekly open is shown only on timeframes < weekly
- Monthly open is shown only on timeframes < monthly
發行說明
Add an option to show tails on opens (disabled by default). Tails can help to better visualize how price previously traded at these levels.In addition, for low timeframes, it provides a work around for PineScript not drawing a line if the open isn't yet visible on the screen.
發行說明
Allow changing colors發行說明
Minor fix on updating issue.發行說明
- Add yearly open
- Allow individual coloring
- Minor fixes and improvements
發行說明
- Enable showing previous opens with an option to project lines on the right side
- Display values on the price scale, status line, and data window
- Upgrade labels with tooltips showing opening prices
- Add alerts
- Expose new setting for discovering opening prices from the intraday instead of high time frames
- Expose new setting for plotting opening prices from extended hours instead of regular hours
- General improvements
發行說明
v7- Implemented configurable timeframes
- Added the quarter open
- Updated Pine to v6
- Added minor improvements
開源腳本
本著TradingView的真正精神,此腳本的創建者將其開源,以便交易者可以查看和驗證其功能。向作者致敬!雖然您可以免費使用它,但請記住,重新發佈程式碼必須遵守我們的網站規則。
🌟 Listed as "Trusted Pine Programmer"
👨💻 Coding services: sbtnc.dev/hire-pine-script-developer
🔒 Premium indicators: sbtnc.gumroad.com
☕️ Tip: buymeacoffee.com/sbtnc
👨💻 Coding services: sbtnc.dev/hire-pine-script-developer
🔒 Premium indicators: sbtnc.gumroad.com
☕️ Tip: buymeacoffee.com/sbtnc
免責聲明
這些資訊和出版物並不意味著也不構成TradingView提供或認可的金融、投資、交易或其他類型的意見或建議。請在使用條款閱讀更多資訊。