OPEN-SOURCE SCRIPT
已更新 Multi-timeframe Stochastic RSI
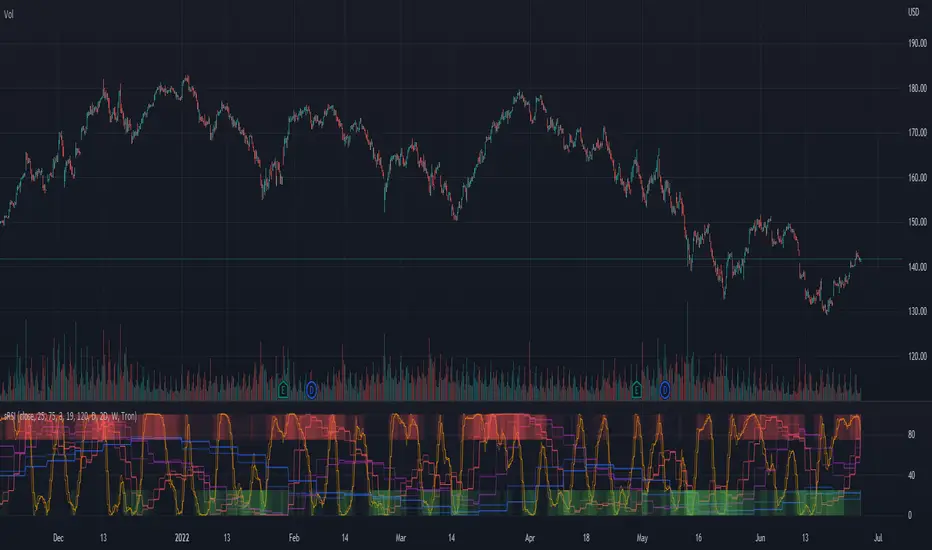
The multi-timeframe stochastic RSI utilizes stochastic RSI signals from 11 different time-frames to indicate whether overbought/oversold signals are in agreement or not across time-frames. Ideally traders should enter and exit when conditions are in agreement as indicated by the intensity of the long (green) or short (red) bands at the top and bottom of the indicator. The intensity of the bands indicates how many of the time-frames are currently overbought/oversold.
發行說明
Updated script so that it auto adjust to the chart time-frame. 發行說明
Script now auto-adjusts the time-frames used in the oversold and overbought regions as well as the time-frames displayed to the timeframe of the chart.Selecting "manual sRSI" allows you to adjust the time-frames displayed, but not the timeframes used for the oversold and overbought regions.
Selecting "I have free TV" adjusts the chart to only use the basic timeframes.
Minor edits to retain original functionality: Select "I have free TV" and "Manual sRSI" for v1 behavior.
開源腳本
秉持TradingView一貫精神,這個腳本的創作者將其設為開源,以便交易者檢視並驗證其功能。向作者致敬!您可以免費使用此腳本,但請注意,重新發佈代碼需遵守我們的社群規範。
免責聲明
這些資訊和出版物並非旨在提供,也不構成TradingView提供或認可的任何形式的財務、投資、交易或其他類型的建議或推薦。請閱讀使用條款以了解更多資訊。
開源腳本
秉持TradingView一貫精神,這個腳本的創作者將其設為開源,以便交易者檢視並驗證其功能。向作者致敬!您可以免費使用此腳本,但請注意,重新發佈代碼需遵守我們的社群規範。
免責聲明
這些資訊和出版物並非旨在提供,也不構成TradingView提供或認可的任何形式的財務、投資、交易或其他類型的建議或推薦。請閱讀使用條款以了解更多資訊。