OPEN-SOURCE SCRIPT
Improved Z-Score Overlay
Last month I published an improved z-score script that goes underneath your chart, which helps to highlight overbought or oversold regimes. It is customizable, and allows changing the periods, whether smoothing capability is desired, whether to use simple or exponential moving averages, and which data source to use (open, high, low, close, ohlc4).
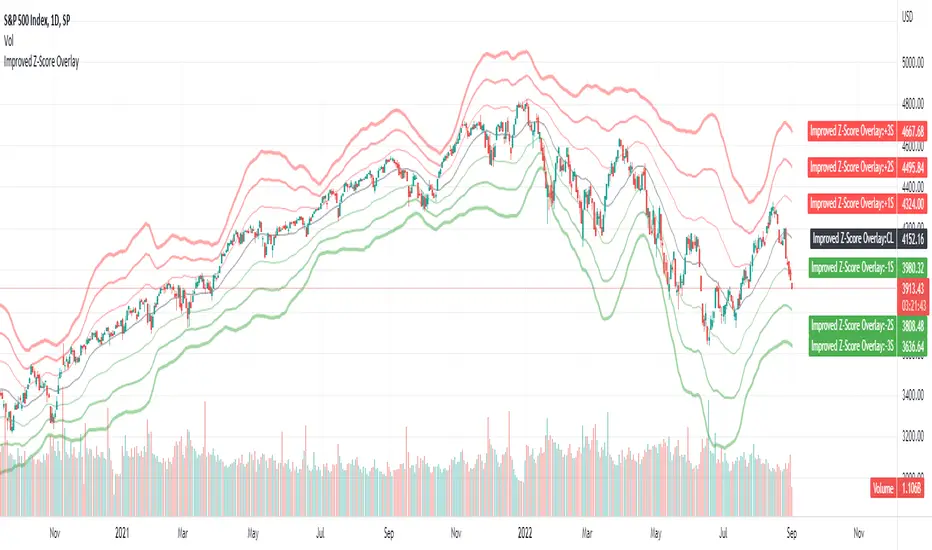
Some individuals may find that it is most useful not only to have the z-score visible underneath their price chart, but have the sigma values clearly visible on the chart itself to determine overbought or oversold levels.
Therefore, this improved z-score overlay script will place the centerline of price on the chart, and +3/+2/+1/0/-1/-2/-3 sigma.
These can be disabled if some values do not want to be shown, and the colors / opacity can be changed.
Additionally, you could also put this into a new pane below your chart and disable all of the +3 to -3 sigma values, and enable the "Z-Score" button. This will allow you to replicate the original Improved Z-Score Script.
If anyone has questions or would like to have any improvements made, let me know :)
- Jim Bosse
開源腳本
本著TradingView的真正精神,此腳本的創建者將其開源,以便交易者可以查看和驗證其功能。向作者致敬!雖然您可以免費使用它,但請記住,重新發佈程式碼必須遵守我們的網站規則。
免責聲明
這些資訊和出版物並不意味著也不構成TradingView提供或認可的金融、投資、交易或其他類型的意見或建議。請在使用條款閱讀更多資訊。
開源腳本
本著TradingView的真正精神,此腳本的創建者將其開源,以便交易者可以查看和驗證其功能。向作者致敬!雖然您可以免費使用它,但請記住,重新發佈程式碼必須遵守我們的網站規則。
免責聲明
這些資訊和出版物並不意味著也不構成TradingView提供或認可的金融、投資、交易或其他類型的意見或建議。請在使用條款閱讀更多資訊。