PROTECTED SOURCE SCRIPT
5 Min Scalping Oscillator
### Overview
The 5 Min Scalping Oscillator is a custom oscillator designed to provide traders with a unified momentum signal by fusing normalized versions of the Relative Strength Index (RSI), Stochastic RSI, and Commodity Channel Index (CCI). This combination creates a more balanced view of market momentum, overbought/oversold conditions, and potential reversals, while incorporating adaptive smoothing, dynamic thresholds, and market condition filters to reduce noise and false signals. Unlike standalone oscillators, the 5 Min Scalping Oscillator adapts to trending or sideways regimes, volatility levels, and higher timeframe biases, making it particularly suited for short-term charts like 5-minute timeframes where quick, filtered signals are valuable.
### Purpose and Originality of the Fusion
Traditional oscillators like RSI measure momentum but can lag in volatile markets; Stochastic RSI adds sensitivity to RSI extremes but often generates excessive noise; and CCI identifies cyclical deviations but may overreact to minor price swings. The 5 Min Scalping Oscillator addresses these limitations by weighting and blending their normalized outputs (RSI at 45%, Stochastic RSI at 35%, and CCI at 20%) into a single raw oscillator value. This weighted fusion creates a hybrid signal that balances lag reduction with noise filtering, resulting in a more robust indicator for identifying reversal opportunities.
The originality lies in extending this fusion with:
- **Adaptive Smoothing via KAMA (Kaufman's Adaptive Moving Average):** Adjusts responsiveness based on market efficiency, speeding up in trends and slowing in ranges—unlike fixed EMAs, this helps preserve signal integrity without over-smoothing.
- **Dynamic Overbought/Oversold Thresholds:** Calculated using rolling percentiles over a user-defined lookback (default 200+ periods), these levels adapt to recent oscillator behavior rather than relying on static values like 70/30, making the indicator more responsive to asset-specific volatility.
- **Multi-Factor Filters:** Integrates ADX for trend detection, ATR percentiles for volatility confirmation, and optional higher timeframe RSI bias to ensure signals align with broader market context. This layered approach reduces false positives (e.g., ignoring low-volatility crossovers) and adds a confidence score based on filter alignment, which is not typically found in simple mashups.
This design justifies the combination: it's not a mere overlay of indicators but a purposeful integration that enhances usefulness by providing context-aware signals, helping traders avoid common pitfalls like trading against the trend or in low-volatility chop. The result is an original tool that performs better in diverse conditions, especially on 5-minute charts for intraday trading, where rapid adaptations are key.
### How It Works
The 5 Min Scalping Oscillator processes price data through these steps:
1. **Normalization and Fusion:**
- RSI (default length 10) is normalized to a -1 to +1 scale using a tanh transformation for bounded output.
- Stochastic RSI (default length 14) is derived from RSI highs/lows and scaled similarly.
- CCI (default length 14) is tanh-normalized to align with the others.
- These are weighted and summed into a raw value, emphasizing RSI for core momentum while using Stochastic RSI for edge sensitivity and CCI for cycle detection.
2. **Smoothing and Signal Line:**
- The raw value is smoothed (default KAMA with fast/slow periods 2/30 and efficiency length 10) to reduce whipsaws.
- A shorter signal line (half the smoothing length) is added for crossover detections.
3. **Filters and Enhancements:**
- **Trend Regime:** ADX (default length 14, threshold 20) classifies markets as trending (ADX > threshold) or sideways, allowing signals in both but prioritizing alignment.
- **Volatility Check:** ATR (default length 14) percentile (default 85%) ensures signals only trigger in above-average volatility, filtering out flat markets.
- **Higher Timeframe Bias:** Optional RSI (default length 14 on 60-minute timeframe) provides bull/neutral/bear bias (above 55, 45-55, below 45), requiring signal alignment (e.g., bullish signals only if bias is neutral or bull).
- **Dynamic Levels:** Percentiles (default OB 85%, OS 15%) over recent oscillator values set adaptive overbought/oversold lines.
4. **Signal Generation:**
- Bullish (B) signals on upward crossovers of the smoothed line over the signal line, filtered by conditions.
- Bearish (S) signals on downward crossunders.
- Each signal includes a confidence score (0-100) based on factors like trend alignment (25 points), volatility (15 points), and bias (20 points if strong, 10 if neutral).
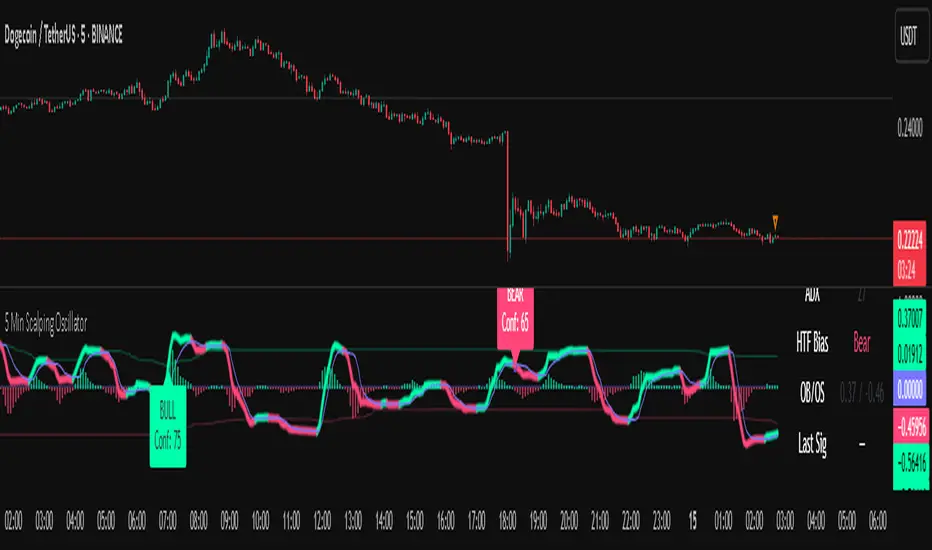
The output includes a glowing oscillator line, histogram for divergence spotting, dynamic levels, shapes/labels for signals, and a dashboard table summarizing regime, ADX, bias, levels, and last signal.
### How to Use It
This indicator is easy to apply and interpret, even for beginners:
- **Adding to Chart:** Apply the 5 Min Scalping Oscillator to a clean chart (no other indicators unless explained). It's non-overlay, so it appears in a separate pane. For 5-minute timeframes, keep defaults or tweak lengths shorter for faster response (e.g., RSI 8-12).
- **Interpreting Signals:**
- Look for green upward triangles labeled "B" (bullish) at the bottom for potential entry opportunities in uptrends or reversals.
- Red downward triangles labeled "S" (bearish) at the top signal potential exits or shorts.
- Higher confidence scores (e.g., 70+) indicate stronger alignment—use these for priority trades.
- Watch the histogram for divergences (e.g., price higher highs but histogram lower highs suggest weakening momentum).
- Dynamic OB (green line) and OS (red line) help gauge extremes; signals near these are more reliable.
- **Dashboard:** At the bottom-right, it shows real-time info like "Trending" or "Sideways" regime, ADX value, HTF bias (Bull/Neutral/Bear), OB/OS levels, and last signal—use this for quick context.
- **Customization:** Adjust inputs via the settings panel:
- Toggle KAMA for adaptive vs. EMA smoothing.
- Set HTF to "60" for 1-hour bias on 5-min charts.
- Increase ADX threshold to 25 for stricter trend filtering.
- **Best Practices:** Combine with price action (e.g., support/resistance) or volume for confirmation. On 5-min charts, pair with a 1-hour HTF for intraday scalping. Always use stop-losses and risk no more than 1-2% per trade.
### Default Settings Explanation
Defaults are optimized for 5-minute charts on volatile assets like stocks or forex:
- RSI/Stoch/CCI lengths (10/14/14): Shorter for quick momentum capture.
- Signal smoothing (5): Responsive without excessive lag.
- ADX threshold (20): Balances trend detection.
- ATR percentile (0.85): Filters ~15% of low-vol signals.
- HTF RSI (14 on 60-min): Aligns with hourly trends.
- Percentiles (OB 85%, OS 15%): Adaptive to recent data.
If changing, test on historical data to ensure fit—e.g., longer lengths for less noisy assets.
### Disclaimer
The 5 Min Scalping Oscillator is an educational tool to visualize momentum and does not guarantee profits or predict future performance. All signals are based on historical calculations and should not be used as standalone trading advice. Past results are not indicative of future outcomes. Traders must conduct their own analysis, use proper risk management, and consider market conditions. No claims are made about accuracy, reliability, or performance.
The 5 Min Scalping Oscillator is a custom oscillator designed to provide traders with a unified momentum signal by fusing normalized versions of the Relative Strength Index (RSI), Stochastic RSI, and Commodity Channel Index (CCI). This combination creates a more balanced view of market momentum, overbought/oversold conditions, and potential reversals, while incorporating adaptive smoothing, dynamic thresholds, and market condition filters to reduce noise and false signals. Unlike standalone oscillators, the 5 Min Scalping Oscillator adapts to trending or sideways regimes, volatility levels, and higher timeframe biases, making it particularly suited for short-term charts like 5-minute timeframes where quick, filtered signals are valuable.
### Purpose and Originality of the Fusion
Traditional oscillators like RSI measure momentum but can lag in volatile markets; Stochastic RSI adds sensitivity to RSI extremes but often generates excessive noise; and CCI identifies cyclical deviations but may overreact to minor price swings. The 5 Min Scalping Oscillator addresses these limitations by weighting and blending their normalized outputs (RSI at 45%, Stochastic RSI at 35%, and CCI at 20%) into a single raw oscillator value. This weighted fusion creates a hybrid signal that balances lag reduction with noise filtering, resulting in a more robust indicator for identifying reversal opportunities.
The originality lies in extending this fusion with:
- **Adaptive Smoothing via KAMA (Kaufman's Adaptive Moving Average):** Adjusts responsiveness based on market efficiency, speeding up in trends and slowing in ranges—unlike fixed EMAs, this helps preserve signal integrity without over-smoothing.
- **Dynamic Overbought/Oversold Thresholds:** Calculated using rolling percentiles over a user-defined lookback (default 200+ periods), these levels adapt to recent oscillator behavior rather than relying on static values like 70/30, making the indicator more responsive to asset-specific volatility.
- **Multi-Factor Filters:** Integrates ADX for trend detection, ATR percentiles for volatility confirmation, and optional higher timeframe RSI bias to ensure signals align with broader market context. This layered approach reduces false positives (e.g., ignoring low-volatility crossovers) and adds a confidence score based on filter alignment, which is not typically found in simple mashups.
This design justifies the combination: it's not a mere overlay of indicators but a purposeful integration that enhances usefulness by providing context-aware signals, helping traders avoid common pitfalls like trading against the trend or in low-volatility chop. The result is an original tool that performs better in diverse conditions, especially on 5-minute charts for intraday trading, where rapid adaptations are key.
### How It Works
The 5 Min Scalping Oscillator processes price data through these steps:
1. **Normalization and Fusion:**
- RSI (default length 10) is normalized to a -1 to +1 scale using a tanh transformation for bounded output.
- Stochastic RSI (default length 14) is derived from RSI highs/lows and scaled similarly.
- CCI (default length 14) is tanh-normalized to align with the others.
- These are weighted and summed into a raw value, emphasizing RSI for core momentum while using Stochastic RSI for edge sensitivity and CCI for cycle detection.
2. **Smoothing and Signal Line:**
- The raw value is smoothed (default KAMA with fast/slow periods 2/30 and efficiency length 10) to reduce whipsaws.
- A shorter signal line (half the smoothing length) is added for crossover detections.
3. **Filters and Enhancements:**
- **Trend Regime:** ADX (default length 14, threshold 20) classifies markets as trending (ADX > threshold) or sideways, allowing signals in both but prioritizing alignment.
- **Volatility Check:** ATR (default length 14) percentile (default 85%) ensures signals only trigger in above-average volatility, filtering out flat markets.
- **Higher Timeframe Bias:** Optional RSI (default length 14 on 60-minute timeframe) provides bull/neutral/bear bias (above 55, 45-55, below 45), requiring signal alignment (e.g., bullish signals only if bias is neutral or bull).
- **Dynamic Levels:** Percentiles (default OB 85%, OS 15%) over recent oscillator values set adaptive overbought/oversold lines.
4. **Signal Generation:**
- Bullish (B) signals on upward crossovers of the smoothed line over the signal line, filtered by conditions.
- Bearish (S) signals on downward crossunders.
- Each signal includes a confidence score (0-100) based on factors like trend alignment (25 points), volatility (15 points), and bias (20 points if strong, 10 if neutral).
The output includes a glowing oscillator line, histogram for divergence spotting, dynamic levels, shapes/labels for signals, and a dashboard table summarizing regime, ADX, bias, levels, and last signal.
### How to Use It
This indicator is easy to apply and interpret, even for beginners:
- **Adding to Chart:** Apply the 5 Min Scalping Oscillator to a clean chart (no other indicators unless explained). It's non-overlay, so it appears in a separate pane. For 5-minute timeframes, keep defaults or tweak lengths shorter for faster response (e.g., RSI 8-12).
- **Interpreting Signals:**
- Look for green upward triangles labeled "B" (bullish) at the bottom for potential entry opportunities in uptrends or reversals.
- Red downward triangles labeled "S" (bearish) at the top signal potential exits or shorts.
- Higher confidence scores (e.g., 70+) indicate stronger alignment—use these for priority trades.
- Watch the histogram for divergences (e.g., price higher highs but histogram lower highs suggest weakening momentum).
- Dynamic OB (green line) and OS (red line) help gauge extremes; signals near these are more reliable.
- **Dashboard:** At the bottom-right, it shows real-time info like "Trending" or "Sideways" regime, ADX value, HTF bias (Bull/Neutral/Bear), OB/OS levels, and last signal—use this for quick context.
- **Customization:** Adjust inputs via the settings panel:
- Toggle KAMA for adaptive vs. EMA smoothing.
- Set HTF to "60" for 1-hour bias on 5-min charts.
- Increase ADX threshold to 25 for stricter trend filtering.
- **Best Practices:** Combine with price action (e.g., support/resistance) or volume for confirmation. On 5-min charts, pair with a 1-hour HTF for intraday scalping. Always use stop-losses and risk no more than 1-2% per trade.
### Default Settings Explanation
Defaults are optimized for 5-minute charts on volatile assets like stocks or forex:
- RSI/Stoch/CCI lengths (10/14/14): Shorter for quick momentum capture.
- Signal smoothing (5): Responsive without excessive lag.
- ADX threshold (20): Balances trend detection.
- ATR percentile (0.85): Filters ~15% of low-vol signals.
- HTF RSI (14 on 60-min): Aligns with hourly trends.
- Percentiles (OB 85%, OS 15%): Adaptive to recent data.
If changing, test on historical data to ensure fit—e.g., longer lengths for less noisy assets.
### Disclaimer
The 5 Min Scalping Oscillator is an educational tool to visualize momentum and does not guarantee profits or predict future performance. All signals are based on historical calculations and should not be used as standalone trading advice. Past results are not indicative of future outcomes. Traders must conduct their own analysis, use proper risk management, and consider market conditions. No claims are made about accuracy, reliability, or performance.
受保護腳本
此腳本以閉源形式發佈。 不過,您可以自由使用,沒有任何限制 — 點擊此處了解更多。
🌐🔗💻PREMIUM INDICATORS💎🤑💰💰 - botboost.in
➤🌐⌯⌲➣ TELEGRAM GROUP - t.me/tradingarmourofficial ➤🌐⌯⌲➣
➤🌐⌯⌲➣ TELEGRAM GROUP - t.me/tradingarmourofficial ➤🌐⌯⌲➣
免責聲明
這些資訊和出版物並非旨在提供,也不構成TradingView提供或認可的任何形式的財務、投資、交易或其他類型的建議或推薦。請閱讀使用條款以了解更多資訊。
受保護腳本
此腳本以閉源形式發佈。 不過,您可以自由使用,沒有任何限制 — 點擊此處了解更多。
🌐🔗💻PREMIUM INDICATORS💎🤑💰💰 - botboost.in
➤🌐⌯⌲➣ TELEGRAM GROUP - t.me/tradingarmourofficial ➤🌐⌯⌲➣
➤🌐⌯⌲➣ TELEGRAM GROUP - t.me/tradingarmourofficial ➤🌐⌯⌲➣
免責聲明
這些資訊和出版物並非旨在提供,也不構成TradingView提供或認可的任何形式的財務、投資、交易或其他類型的建議或推薦。請閱讀使用條款以了解更多資訊。