PROTECTED SOURCE SCRIPT
DBI MTF
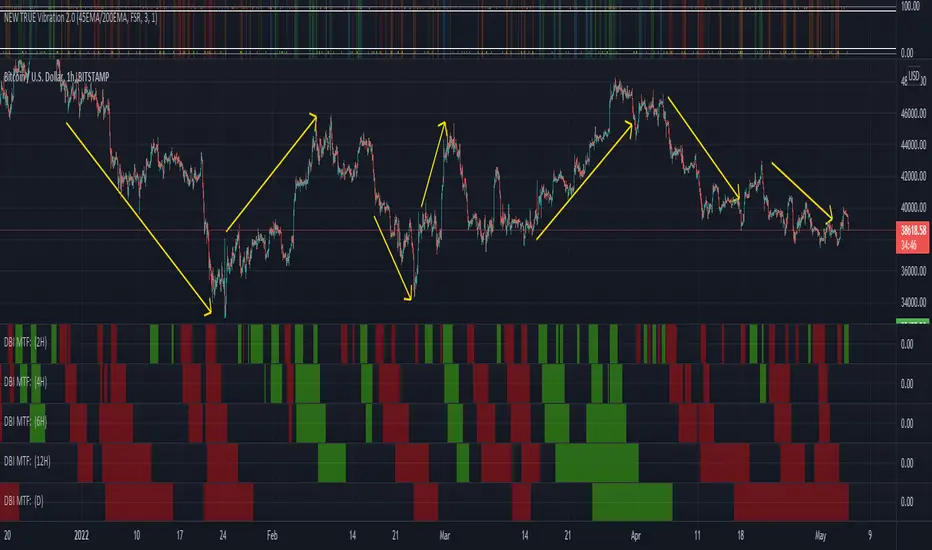
DBI is the Directional Bias Indicator
This is a Daily timeframe concept that we can take to MTF's. What DBI does it takes an advanced look at Trend to produce four results... Active Green (which simply gives EDGE to buying exhausted or weak pullbacks that hold Bull Market Structure), Last Green (which means the indicator turned active Green and lost some of the characteristics that allowed it to go Active Green (this is a natural part of any pullback process and during these times there is still EDGE to finding confluent reasons too look for Longs until the indicator again turns to Active Red)), Active Red (which simply gives EDGE to shorting exhausted or weak bounces that hold Bear Market Structure), and Last RED (which means the indicator turned active Red and lost some of the characteristics that allowed it to go Active Green (this is a natural part of any pullback process and during these times there is still EDGE to finding confluent reasons too short until the indicator again turns to Active Green)).
As mentioned, this is a Daily TF concept, but, this indicator allows you to look at the same formula from the 5-minute chart to the Weekly chart. The benefit here is that it can allow the trained eye to get a better view at times where Longs have the path of least resistance and time when shorts have the path of least resistance. If we can give ourselves some extra EDGE toward knowing the path of least resistance on time frames that are above our trigger TF (The TF we plan to take a trade on) then we can be better prepared to either keep a tighter stop or perhaps give a Long or a Short more room to run due to what seems to be a friendly environment.
This indicator takes some time to understand, but, it has also been a massive favorite for many True Vibration 2.0 users for quite some time as this was previously built into that indicator. Utilizing True Vibration 2.0 along with DBI will heighten your experience dramatically.
受保護腳本
此腳本以閉源形式發佈。 不過,您可以自由使用,沒有任何限制 — 點擊此處了解更多。
免責聲明
這些資訊和出版物並非旨在提供,也不構成TradingView提供或認可的任何形式的財務、投資、交易或其他類型的建議或推薦。請閱讀使用條款以了解更多資訊。
受保護腳本
此腳本以閉源形式發佈。 不過,您可以自由使用,沒有任何限制 — 點擊此處了解更多。
免責聲明
這些資訊和出版物並非旨在提供,也不構成TradingView提供或認可的任何形式的財務、投資、交易或其他類型的建議或推薦。請閱讀使用條款以了解更多資訊。