PROTECTED SOURCE SCRIPT
[Top] MTF Supply-Demand Zones
[Top] MTF Supply-Demand Zones
The “MTF Supply-Demand Zones” indicator is a sophisticated, multi-timeframe analysis tool designed to help traders visually identify key supply and demand areas across multiple timeframes simultaneously (Daily, 4-hour, 1-hour, and 15-minute). It has been designed for maximum ease of use and customization to make it effective for all trading styles.

How It Works:
The indicator detects supply and demand zones based on a clear and reliable candle pattern:
Zones are validated and drawn upon the closure of candles on higher timeframes, ensuring accuracy and reliability.
Core Features:
What Makes It Unique:
How to Use:
This indicator is ideal for traders seeking clarity on multi-timeframe support and resistance dynamics, providing insights into potential price reversal points.
The “MTF Supply-Demand Zones” indicator is a sophisticated, multi-timeframe analysis tool designed to help traders visually identify key supply and demand areas across multiple timeframes simultaneously (Daily, 4-hour, 1-hour, and 15-minute). It has been designed for maximum ease of use and customization to make it effective for all trading styles.
How It Works:
The indicator detects supply and demand zones based on a clear and reliable candle pattern:
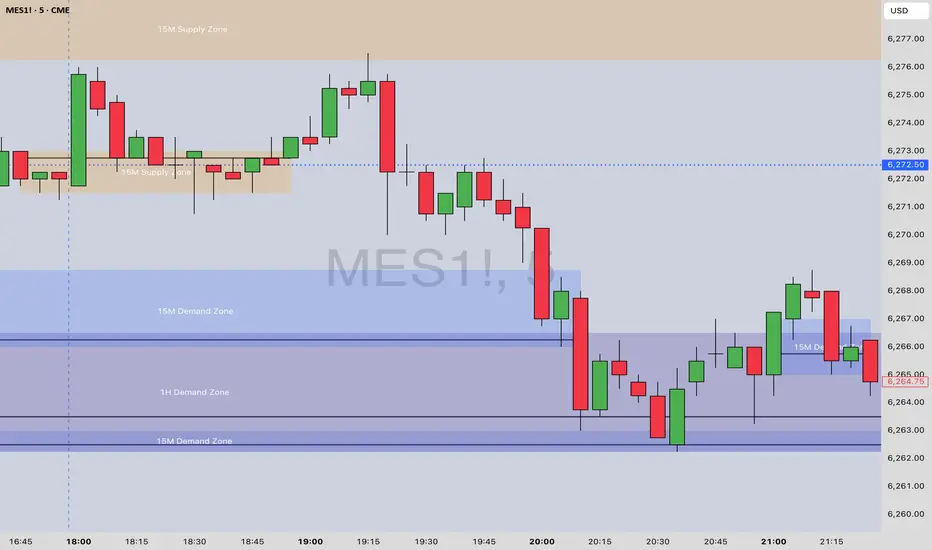
- Demand Zones are identified when a small bearish candle (red) is immediately followed by a significantly larger bullish candle (green). The demand zone spans from the high to the close of the bearish candle, with a bounce line drawn at the statistically most likely point of reversal.
- Supply Zones are identified when a small bullish candle (green) is immediately followed by a substantially larger bearish candle (red). The supply zone spans from the close to the low of the bullish candle, with a bounce line drawn at the statistically most likely point of reversal.
Zones are validated and drawn upon the closure of candles on higher timeframes, ensuring accuracy and reliability.
Core Features:
- Multi-Timeframe Analysis: Simultaneously tracks and visually represents supply and demand zones from Daily, 4-hour, 1-hour, and 15-minute charts directly onto a single chart.
- Dynamic Zone Validation: Zones are continuously monitored for invalidation—once price action penetrates a zone, it becomes inactive and ceases to extend further, clearly marking its relevance to current price action.
- Bounce Lines: Clearly visible lines within each zone indicate potential entry or bounce points for traders.
- Automated Zone Labeling: Optional labels at the center of each zone clearly identify the timeframe and type of zone (e.g., “15M Supply Zone”).
- Fully Customizable Colors: Users can customize zone colors for easy differentiation between timeframes and zone types, providing clear and intuitive chart visuals.
What Makes It Unique:
- Bounce Line Inclusion: Unlike typical supply-demand indicators, this script distinctly marks potential reaction points within each zone using a bounce line. This provides traders with a precise visual reference for potential price reversals or continuations, improving decision-making accuracy.
- Extensive Visual Customization: The indicator offers extensive visual customization options, allowing traders to independently adjust colors for each zone and bounce line per timeframe. This customization enhances visual clarity and helps traders quickly distinguish between various trading scenarios.
How to Use:
- Enable or disable visibility for each timeframe zone depending on your trading strategy.
- Customize zone and bounce line colors to visually organize and prioritize zones on your charts.
- Utilize the automated labeling system to quickly identify and assess the strength and relevance of each zone.
- Watch for price reactions within the marked zones, using bounce lines to identify optimal trade entry points.
This indicator is ideal for traders seeking clarity on multi-timeframe support and resistance dynamics, providing insights into potential price reversal points.
受保護腳本
此腳本以閉源形式發佈。 不過,您可以自由且不受任何限制地使用它 — 在此處了解更多資訊。
免責聲明
這些資訊和出版物並不意味著也不構成TradingView提供或認可的金融、投資、交易或其他類型的意見或建議。請在使用條款閱讀更多資訊。
受保護腳本
此腳本以閉源形式發佈。 不過,您可以自由且不受任何限制地使用它 — 在此處了解更多資訊。
免責聲明
這些資訊和出版物並不意味著也不構成TradingView提供或認可的金融、投資、交易或其他類型的意見或建議。請在使用條款閱讀更多資訊。