INVITE-ONLY SCRIPT
PALGO
WHAT DOES THE SCRIPT DO & HOW IT IS BEING DONE :
This script is designed by using some momentum indicators and oscillators like RSI and stochastic to identify the momentum of the stock. Whenever there is a start of momentum the stochastic indicator combined to the RSI and other oscillator gives a cross signal & alert a user to look for either BUY or SELL opportunity in the stock.
When there is a gain in momentum , the script uses RSI & Bollinger bands to identify the breakout & provides a buy/sell signal for taking entry into the trade.
Few moving averages helps a user to hold the trade by providing a signal on the chart after each candle’s closing in the form of triangles.
The script provides a signal in the form of a circle to exit the position when the price gets overbought/oversold . Here the script uses the momentum indicators RSI & MACD & stochastic in combination.
HOW TO USE THE SCRIPT:
General parameters:
1. Best suitable for stocks to trade in equity/futures segment.
2. Do not apply on Index like nifty or banknifty/ commodities /forex/ and cryptos
3. Strictly use only on 1 hour time frame. (Best tested results are on 1 hour time frame)
4. Use only to take swing trades only.
How to interpret the signals :
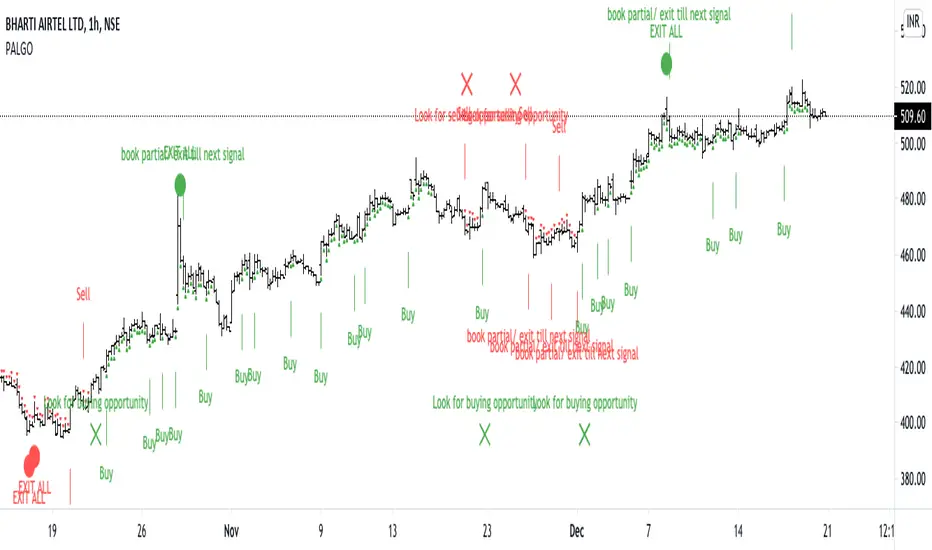
1. Wait for a ‘X’ sign before mind make up. A red ‘X’ means look for selling opportunity , a green ‘X’ means look for buying opportunity. After getting the X sign the user will be shown a text signal whether to look for buying opportunity or selling opportunity
Taking a position:
2. Wait for an arrow before entering into any position. A red arrow on upside of a bar pointing downward means open short position. A green arrow below the bar pointing upward means open buy position. After getting the arrr sign the user will be shown a text signal whether to create a buy position or sell position.
NOTE: Only after the the signalling of X , look for arrow. Do not buy/sell if you see any arrow before the signal of X.
STOP LOSS should be the most recent swing high/low or most recent STRONG CANDLE’S high/low.
While maintaining the position :
3. The small triangles after the each bar completion tells you to hold the position. The red triangles appearing upside on the bar tells you to hold the short position, whereas the green triangles appearing below the bars tells you to hold the long position.
Exiting the position:
4. After you create a buy position , if you see a green arrow above any bar pointing downward, then you should either book partially/leave the position for sometime. You will get another signal to re-enter. With the signal user will be shown a text to indicating for partial book/exit till next signal.
5. Similarly, after you create a sell position , if you see a red arrow below any bar pointing upward, then you should either book partially/leave the position for sometime. You will get another signal to re-enter. With the signal user will be shown a text to indicating for partial book/exit till next signal
While being in position if you see any X signal which is opposite of your trade , then leave your position immediately.
6. When you see a big red circle dot then you must exit all your short positions. Contrary , when you see a big green circle dot , you must exit all your long positions. And then wait for a X-signal. With the signal user will be shown a text to indicating to exit all of the position.
No Trading Zone:
When you get frequent X-signals in green-red-green-red & that too very close, then its means that stock is going to form a range. One should wait for the range break & move away to another stock. (THIS IS WHERE YOU WILL REQUIRE A PRACTICE TO IDENTIFY THE RANGE)
This script is designed by using some momentum indicators and oscillators like RSI and stochastic to identify the momentum of the stock. Whenever there is a start of momentum the stochastic indicator combined to the RSI and other oscillator gives a cross signal & alert a user to look for either BUY or SELL opportunity in the stock.
When there is a gain in momentum , the script uses RSI & Bollinger bands to identify the breakout & provides a buy/sell signal for taking entry into the trade.
Few moving averages helps a user to hold the trade by providing a signal on the chart after each candle’s closing in the form of triangles.
The script provides a signal in the form of a circle to exit the position when the price gets overbought/oversold . Here the script uses the momentum indicators RSI & MACD & stochastic in combination.
HOW TO USE THE SCRIPT:
General parameters:
1. Best suitable for stocks to trade in equity/futures segment.
2. Do not apply on Index like nifty or banknifty/ commodities /forex/ and cryptos
3. Strictly use only on 1 hour time frame. (Best tested results are on 1 hour time frame)
4. Use only to take swing trades only.
How to interpret the signals :
1. Wait for a ‘X’ sign before mind make up. A red ‘X’ means look for selling opportunity , a green ‘X’ means look for buying opportunity. After getting the X sign the user will be shown a text signal whether to look for buying opportunity or selling opportunity
Taking a position:
2. Wait for an arrow before entering into any position. A red arrow on upside of a bar pointing downward means open short position. A green arrow below the bar pointing upward means open buy position. After getting the arrr sign the user will be shown a text signal whether to create a buy position or sell position.
NOTE: Only after the the signalling of X , look for arrow. Do not buy/sell if you see any arrow before the signal of X.
STOP LOSS should be the most recent swing high/low or most recent STRONG CANDLE’S high/low.
While maintaining the position :
3. The small triangles after the each bar completion tells you to hold the position. The red triangles appearing upside on the bar tells you to hold the short position, whereas the green triangles appearing below the bars tells you to hold the long position.
Exiting the position:
4. After you create a buy position , if you see a green arrow above any bar pointing downward, then you should either book partially/leave the position for sometime. You will get another signal to re-enter. With the signal user will be shown a text to indicating for partial book/exit till next signal.
5. Similarly, after you create a sell position , if you see a red arrow below any bar pointing upward, then you should either book partially/leave the position for sometime. You will get another signal to re-enter. With the signal user will be shown a text to indicating for partial book/exit till next signal
While being in position if you see any X signal which is opposite of your trade , then leave your position immediately.
6. When you see a big red circle dot then you must exit all your short positions. Contrary , when you see a big green circle dot , you must exit all your long positions. And then wait for a X-signal. With the signal user will be shown a text to indicating to exit all of the position.
No Trading Zone:
When you get frequent X-signals in green-red-green-red & that too very close, then its means that stock is going to form a range. One should wait for the range break & move away to another stock. (THIS IS WHERE YOU WILL REQUIRE A PRACTICE TO IDENTIFY THE RANGE)
僅限邀請腳本
僅作者批准的使用者才能訪問此腳本。您需要申請並獲得使用許可,通常需在付款後才能取得。更多詳情,請依照作者以下的指示操作,或直接聯絡TradingSutra。
TradingView不建議在未完全信任作者並了解其運作方式的情況下購買或使用腳本。您也可以在我們的社群腳本中找到免費的開源替代方案。
作者的說明
Manish Bhardwaj (CMT L-1)
Analyst & Co-Founder
tradingsutra.com
waveutra.com
INSTAGRAM-
instagram.com/mansh_25
TWITTER-
twitter.com/mansh_25
YOUTUBE -
@TRADINGSUTRA @WAVESUTRA
Analyst & Co-Founder
tradingsutra.com
waveutra.com
INSTAGRAM-
instagram.com/mansh_25
TWITTER-
twitter.com/mansh_25
YOUTUBE -
@TRADINGSUTRA @WAVESUTRA
免責聲明
這些資訊和出版物並非旨在提供,也不構成TradingView提供或認可的任何形式的財務、投資、交易或其他類型的建議或推薦。請閱讀使用條款以了解更多資訊。