INVITE-ONLY SCRIPT
已更新 EP Keeper Indicator
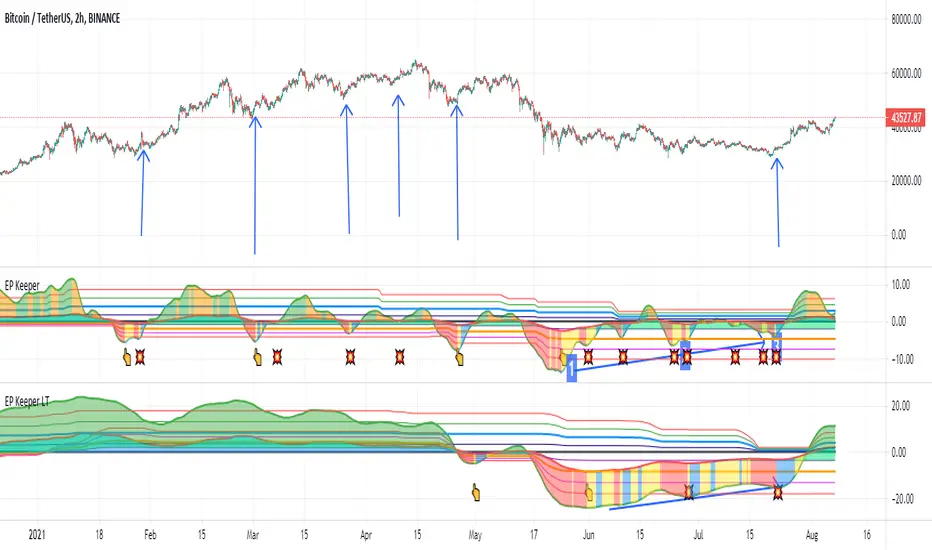
EP Keeper is a trend indicator, showing the relationship between two configurable averages in different periods.
These averages are smoothed to avoid the "noise" of the price, facilitating the visualization of the movement of the asset.
The areas between the two averages are colored in different colors to make them even easier to read.
It can be configured with different periods so that the indicator shows the trend in the short, medium or long term. In fact, we have split the indicator into three (EP Keeper, EP Keeper LT and EP Keeper XLT) with the default settings that we understand give more useful information.
The configuration of EP Keeper helps us to reflect the faster movements of the price. They will help us fine-tune the input to the maximum. Keeper LT shows us the medium-term trend and EP Keeper XLT gives us a vision of the very long-term trend. Trading with all three settings in sight we get a very quick view of how the price is moving.
Apart from the averages, the indicator draws a horizontal line (line 0), four upper lines (max A, max B, max C and max D) and four lower lines (min A, min B, min C and min D) . These lines are calculated based on the highs and lows that the averages have made in the last 1000 candles (this value is configurable).
The objective of these lines is to give an idea of the "depth" of the movements or what is the same, the volatility of the price.
The indicator gives us several signals:
1.- We call "bottom pattern" to the recovery of the keeper averages below line 0 (the indicator is colored yellow). We will be aware of this situation to look for entries, as long as the other keeper configurations also show us signs of recovery.
2.- We call the recovery of the keeper media above line 0 "valley" (the indicator remains colored green).
The indicator shows several tradable patterns, with high probability of success. These are some:
1.- Unique bottom in an upward trend. In a general uptrend there is a bottom in the keeper.
2.- Shoulder-Head-Shoulder. Three bottoms are displayed, the first two declining and the third highest.
3.- Double divergent bottom. Two funds follow one another, the second of them higher.
In general, the purchase operation would be:
1.- Observe the situation of keeper LT and keeper XLT. They must be recovering (bottom pattern) or already above min A (the indicator is colored green).
2.- Observe the keeper situation. We will always look for the background pattern to enter. A "deep" bottom, which occurs below the last line of the lows (min D), indicates a strong rebound movement, as long as the lines of the lows show quite a distance from each other.
3.- Be aware of the highest lows: the bottom pattern (or valley, if we are already in an uptrend) occurs at a higher height than the previous one.
4.- The operation for sales (or closing of long operations) will be the reverse: the fastest average turns downwards in the guardian (if we are in an intraday or fast operation, if we are maintaining a longer-term operation, we we will fix on Keeper LT).
5.- Be aware also of divergences. Keeper displays price divergences especially well by giving us long or short entry signals, depending on the asset's price action.
發行說明
- Added color (orange) when the main line descends, and is above 0. In this situation we would avoid purchases.- Added blue color when the averages are rising on the Zenith indicator, showing an upward trend
- Added the option to show or not show the bottoms. Higher backgrounds are shown with a different icon (explosion). This function is in the experimental phase, it is not entirely reliable.
- Added the possibility of programming alerts on these funds (Alert Line greater than 0)
We remember that the funds are not calls to purchase, only important points to evaluate. In a bullish situation they will show us buy zones, in a bullish situation we will wait for the appearance of a pattern. For instance:
- Three higher bottoms pattern.
- pattern "M" + 1 (three bottoms forming an M, and a fourth behind)
These patterns together with the moving averages on the Keeper LT (same indicator, but with another configuration) gives us a good chance to enter the trend reversal.
僅限邀請腳本
僅作者批准的使用者才能訪問此腳本。您需要申請並獲得使用許可,通常需在付款後才能取得。更多詳情,請依照作者以下的指示操作,或直接聯絡EP-Trading。
TradingView不建議在未完全信任作者並了解其運作方式的情況下購買或使用腳本。您也可以在我們的社群腳本中找到免費的開源替代方案。
作者的說明
Request your free trial, you just have to indicate your TradingView user, by private message or through the means that appear in the signature.
免責聲明
這些資訊和出版物並非旨在提供,也不構成TradingView提供或認可的任何形式的財務、投資、交易或其他類型的建議或推薦。請閱讀使用條款以了解更多資訊。