PROTECTED SOURCE SCRIPT
Normalized Candle Spread with MA
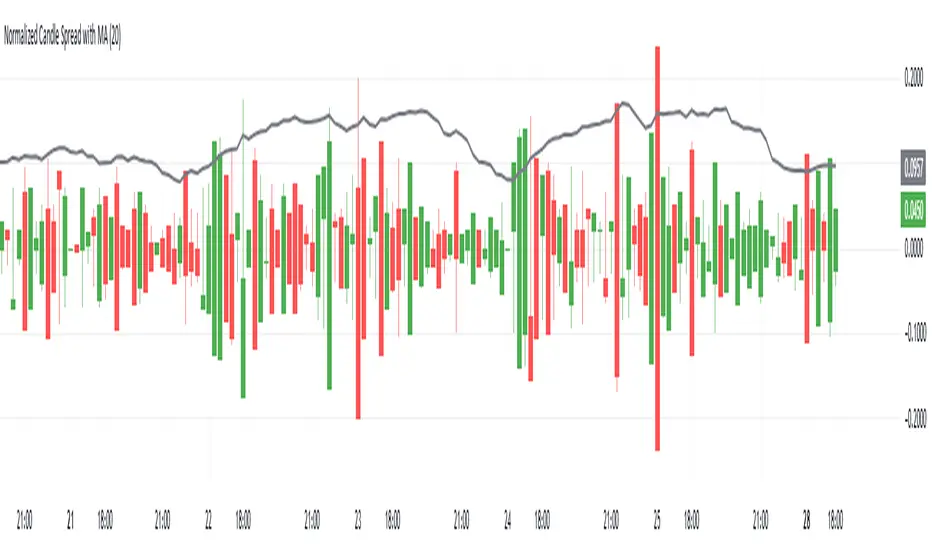
This Pine Script indicator, "Normalized Candle Spread with MA," visualizes candle price action by normalizing the candle bodies and wicks around a baseline (zero level). The normalization centers each candle’s high, low, open, and close prices relative to its own spread (high minus low), so all candles are plotted on the same horizontal line for easy comparison of their shapes and relative sizes.
Key features:
Normalization: Adjusts candle components (open, close, high, low) so they are centered around zero, allowing the comparison of candle shapes regardless of their absolute price levels.
Candle colors: Green for bullish candles (close ≥ open) and red for bearish candles (close < open).
Spread Moving Average: Plots a simple moving average (SMA) of the candle spreads over a user-defined period for visual reference of average volatility.
This indicator helps traders visually assess candle volatility and structure normalized over time, rather than focusing on price levels.
受保護腳本
此腳本以閉源形式發佈。 不過,您可以自由且不受任何限制地使用它 — 在此處了解更多資訊。
免責聲明
這些資訊和出版物並不意味著也不構成TradingView提供或認可的金融、投資、交易或其他類型的意見或建議。請在使用條款閱讀更多資訊。
受保護腳本
此腳本以閉源形式發佈。 不過,您可以自由且不受任何限制地使用它 — 在此處了解更多資訊。
免責聲明
這些資訊和出版物並不意味著也不構成TradingView提供或認可的金融、投資、交易或其他類型的意見或建議。請在使用條款閱讀更多資訊。