PROTECTED SOURCE SCRIPT
Blended Net Liquidity Correlation
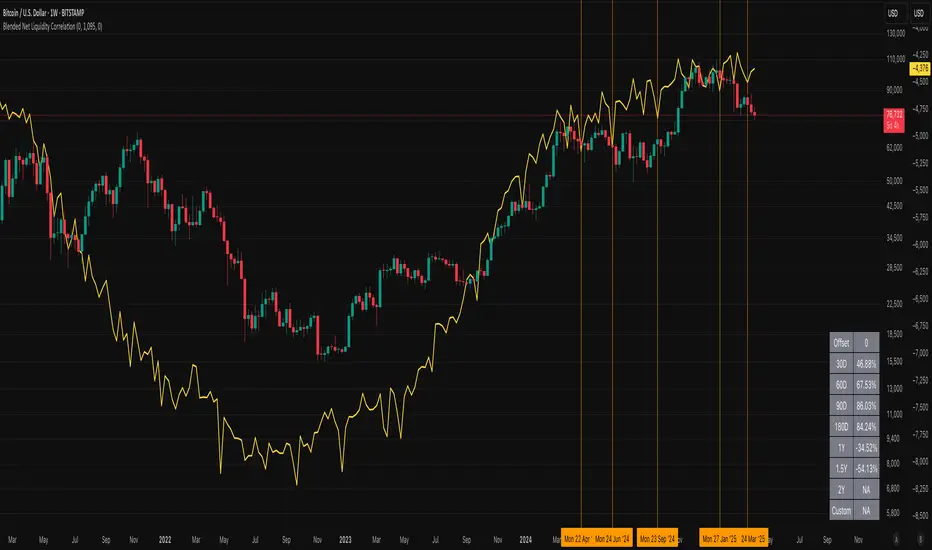
This indicator visualizes a customizable net liquidity metric based on key U.S. Federal Reserve and Treasury data from FRED. It allows users to blend two liquidity models:
• With WALCL: Incorporates the Fed’s total balance sheet (WALCL) — ideal for capturing long-term structural liquidity from QE/QT.
• Without WALCL: Excludes the balance sheet and focuses on short-term operational flows like RRP, TGA, BTFP, and commercial lending.
Use the “Weight on WALCL” slider to find your optimal blend. A setting of 1.0 uses only WALCL, 0.0 uses only short-term flows, and any value in between gives a mix.
The indicator also calculates the correlation between net liquidity and price over various timeframes:
• 30D, 60D, 90D, 180D
• 1Y, 1.5Y, 2Y
• A custom length (default 3 years)
受保護腳本
此腳本以閉源形式發佈。 不過,您可以自由使用,沒有任何限制 — 點擊此處了解更多。
免責聲明
這些資訊和出版物並非旨在提供,也不構成TradingView提供或認可的任何形式的財務、投資、交易或其他類型的建議或推薦。請閱讀使用條款以了解更多資訊。
受保護腳本
此腳本以閉源形式發佈。 不過,您可以自由使用,沒有任何限制 — 點擊此處了解更多。
免責聲明
這些資訊和出版物並非旨在提供,也不構成TradingView提供或認可的任何形式的財務、投資、交易或其他類型的建議或推薦。請閱讀使用條款以了解更多資訊。