OPEN-SOURCE SCRIPT
Multi-Timeframe Pivot Points
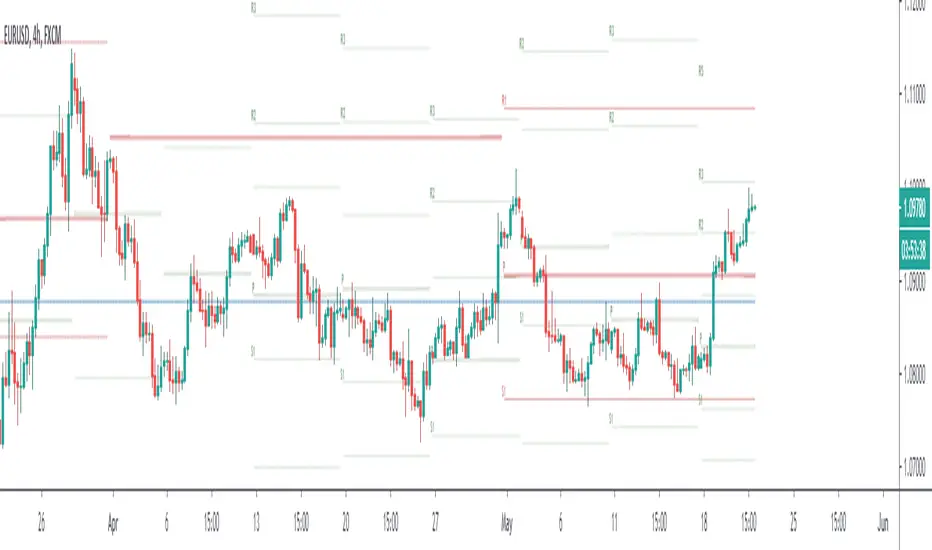
This is a MTF pivot point indicator. I was unhappy with the standard pivot point indicator in Trading View as I wanted to be aware of how price was interacting with pivot points on a higher timeframe. For example, if I'm on the 1H time frame looking at daily pivots, I want to be sure that my trading plan to move between these pivots does not contradict what price is trying to do in relation to the weekly pivots. In addition, sometimes daily and weekly pivots will align increasing probability of a bounce
Ultimately its about trying to automate as much as possible to quickly have an awareness of what might be happening on the timeframe above without having to manual enter levels.
I concluded I don't like the results of this script - whilst i clearly see price interacting with pivots on the current timeframe and higher timeframes there is too much screen clutter on the screen for me.
Rather than delete the script I thought I'd make it available for other people to use. I hope its useful to people. Good luck
(For the record it actually takes a little thinking outside the box to make so many pivots display - you can't just plot hlines. If your a pinescript geek you might like the code)
開源腳本
秉持TradingView一貫精神,這個腳本的創作者將其設為開源,以便交易者檢視並驗證其功能。向作者致敬!您可以免費使用此腳本,但請注意,重新發佈代碼需遵守我們的社群規範。
免責聲明
這些資訊和出版物並非旨在提供,也不構成TradingView提供或認可的任何形式的財務、投資、交易或其他類型的建議或推薦。請閱讀使用條款以了解更多資訊。
開源腳本
秉持TradingView一貫精神,這個腳本的創作者將其設為開源,以便交易者檢視並驗證其功能。向作者致敬!您可以免費使用此腳本,但請注意,重新發佈代碼需遵守我們的社群規範。
免責聲明
這些資訊和出版物並非旨在提供,也不構成TradingView提供或認可的任何形式的財務、投資、交易或其他類型的建議或推薦。請閱讀使用條款以了解更多資訊。