OPEN-SOURCE SCRIPT
已更新 Correlation Stock Market Table by [VanHelsing]
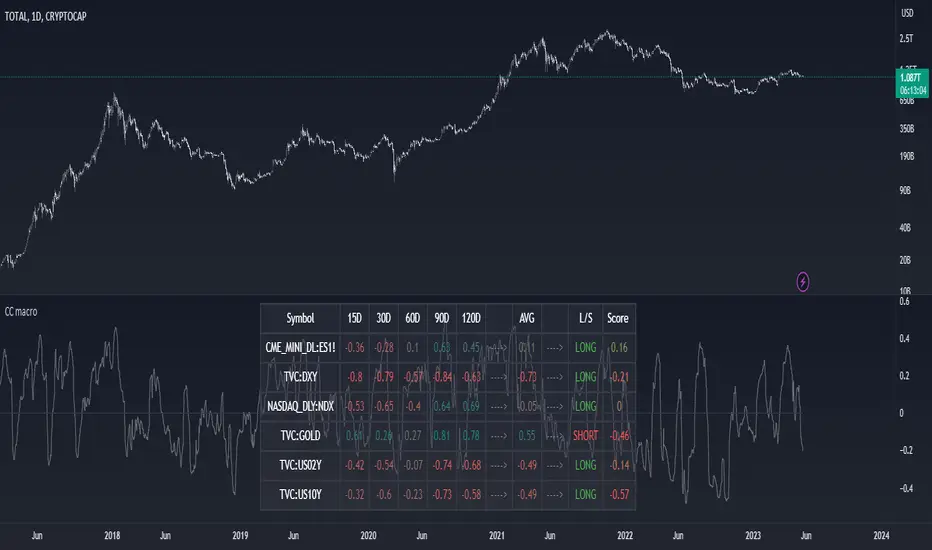
This is a correlation table, it correlates with current opened asset (chart).
In settings you can change periods of days and change assets what you want to see in table.
The main feature of this table is an changing alert, it changes values depends on settings what you chose, you can use it for send whole table to your spreadsheets like screenshot below.

To send a table you need a webhook service.
Like you see it sends whole table to a one cell, so you need separate values by "=TRANSPOSE(SPLIT(cell_id, " "))" it will separate values verticaly by space and then you need separate these values what you now have in a column to the rows horizontaly by function:
=SPLIT(cell_id, ",") now it will separate values by comma.
This is an alert in code

That's it now you have a fully automated table!
In settings you can change periods of days and change assets what you want to see in table.
The main feature of this table is an changing alert, it changes values depends on settings what you chose, you can use it for send whole table to your spreadsheets like screenshot below.
To send a table you need a webhook service.
Like you see it sends whole table to a one cell, so you need separate values by "=TRANSPOSE(SPLIT(cell_id, " "))" it will separate values verticaly by space and then you need separate these values what you now have in a column to the rows horizontaly by function:
=SPLIT(cell_id, ",") now it will separate values by comma.
This is an alert in code
That's it now you have a fully automated table!
發行說明
-發行說明
Added AVG to all periods and symbol and updated Alert發行說明
Added scores, long and short signals from trends of assets. Scores based on correlations and weights for better identify trends (VIX has 0 weight bcs without it table performe better)https://www.tradingview.com/x/ehGuCvHc/
Below a table is an avg weighted score line.
https://www.tradingview.com/x/v4GCQve7/
發行說明
updated alert發行說明
Optimized to TOTAL Crypto Market Cap發行說明
-發行說明
Updated Inputs names開源腳本
秉持TradingView一貫精神,這個腳本的創作者將其設為開源,以便交易者檢視並驗證其功能。向作者致敬!您可以免費使用此腳本,但請注意,重新發佈代碼需遵守我們的社群規範。
免責聲明
這些資訊和出版物並非旨在提供,也不構成TradingView提供或認可的任何形式的財務、投資、交易或其他類型的建議或推薦。請閱讀使用條款以了解更多資訊。
開源腳本
秉持TradingView一貫精神,這個腳本的創作者將其設為開源,以便交易者檢視並驗證其功能。向作者致敬!您可以免費使用此腳本,但請注意,重新發佈代碼需遵守我們的社群規範。
免責聲明
這些資訊和出版物並非旨在提供,也不構成TradingView提供或認可的任何形式的財務、投資、交易或其他類型的建議或推薦。請閱讀使用條款以了解更多資訊。