OPEN-SOURCE SCRIPT
Smart Dynamic Stop Loss (SDSL) Indicator
Smart Dynamic Stop Loss (SDSL) Indicator
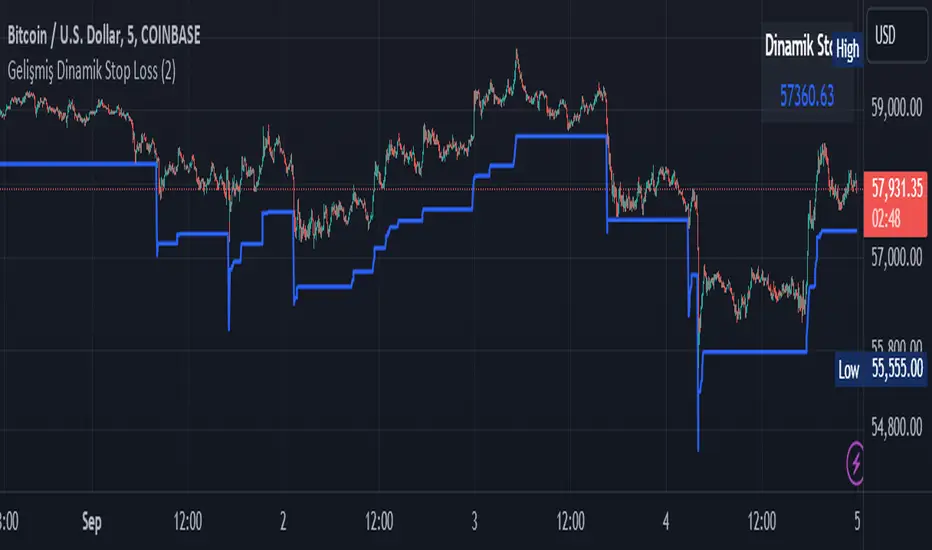
The Smart Dynamic Stop Loss (SDSL) Indicator creates a stop loss level that dynamically adapts to market conditions.
How It Works / How To Calculate:
1. **Initialization**: The indicator initially sets a stop loss level at a specified percentage (default 2%, user-adjustable) below the current price.
2. **Upward Movement**: As the price rises, the stop loss level moves up as well. However, it always remains at the specified percentage below the highest price reached. This allows the price room to move while protecting gains.
3. **Downward or Sideways Movement**: When the price falls or moves sideways, the stop loss level remains static. This prevents premature exits during minor pullbacks or consolidations.
4. **Price Crosses Below Stop Loss**: If the price drops below the stop loss level, the indicator resets. It sets a new stop loss level at the specified percentage below the low of the candle where the crossover occurred.
5. **Continuous Adaptation**: This process repeats across the entire chart, constantly adjusting to price movements.
note: When the price intersects with the dynamic stop loss line, it resets at 2% below the candle's lowest value (this is the default value, but it can be adjusted by the user)
Key Features
- **User-Configurable**: The stop loss percentage can be adjusted by the user.
- **Visual Alerts**: The indicator plots the stop loss line on the chart.
- **Triggered Signals**: Optional visual signals are displayed when the stop loss is triggered.
- **Information Display**: A data box shows the current stop loss level.
Usage
1. Apply the indicator to the chart.
2. Adjust the stop loss percentage if desired (default is 2%).
3. Monitor the dynamic stop loss level.
4. Watch for visual alerts for potential signals.
開源腳本
秉持TradingView一貫精神,這個腳本的創作者將其設為開源,以便交易者檢視並驗證其功能。向作者致敬!您可以免費使用此腳本,但請注意,重新發佈代碼需遵守我們的社群規範。
免責聲明
這些資訊和出版物並非旨在提供,也不構成TradingView提供或認可的任何形式的財務、投資、交易或其他類型的建議或推薦。請閱讀使用條款以了解更多資訊。
開源腳本
秉持TradingView一貫精神,這個腳本的創作者將其設為開源,以便交易者檢視並驗證其功能。向作者致敬!您可以免費使用此腳本,但請注意,重新發佈代碼需遵守我們的社群規範。
免責聲明
這些資訊和出版物並非旨在提供,也不構成TradingView提供或認可的任何形式的財務、投資、交易或其他類型的建議或推薦。請閱讀使用條款以了解更多資訊。