OPEN-SOURCE SCRIPT
已更新 Plot Level on Threshold Exceed
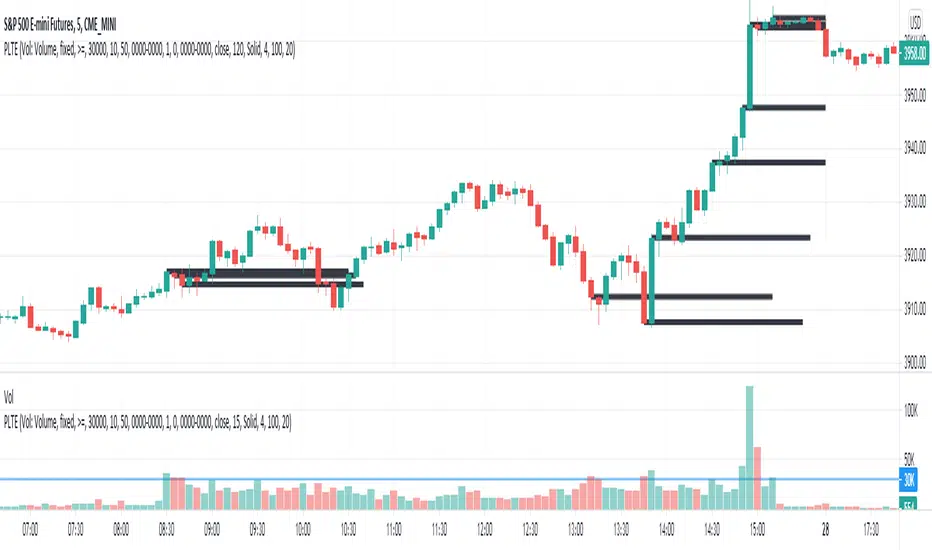
This script plots a line for X minutes, when the given reference source (which could be another indicator like volume, etc), exceeds the fixed value threshold.
There is a line limit in TV, so only the most recent 40 lines are plotted
There is a line limit in TV, so only the most recent 40 lines are plotted
發行說明
Added numerous other threshold types (sma, ema, wma, rma, swma, percentiles)Added custom comparator logic (<, <=, =, >, >=)
Added threshold multiplier
Added ability to plot threshold itself
發行說明
Added in sample session filter (only include samples during desired session times)Added in percentiles and stddev/ma thresholds
Added in efficiencies for line management
Added in plotshape functionality
發行說明
Threshold offset field added to prevent current bar influencing the threshold itself (if desired)發行說明
Updated with additional capabilities for plotarrow and plotchar發行說明
Updated for cross-based comparators發行說明
Updated arrow logic to be in line with threshold break direction, or alternatively select to reverse this logic.開源腳本
本著TradingView的真正精神,此腳本的創建者將其開源,以便交易者可以查看和驗證其功能。向作者致敬!雖然您可以免費使用它,但請記住,重新發佈程式碼必須遵守我們的網站規則。
免責聲明
這些資訊和出版物並不意味著也不構成TradingView提供或認可的金融、投資、交易或其他類型的意見或建議。請在使用條款閱讀更多資訊。
免責聲明
這些資訊和出版物並不意味著也不構成TradingView提供或認可的金融、投資、交易或其他類型的意見或建議。請在使用條款閱讀更多資訊。