PROTECTED SOURCE SCRIPT
已更新 EMA_Cross_Timeframe
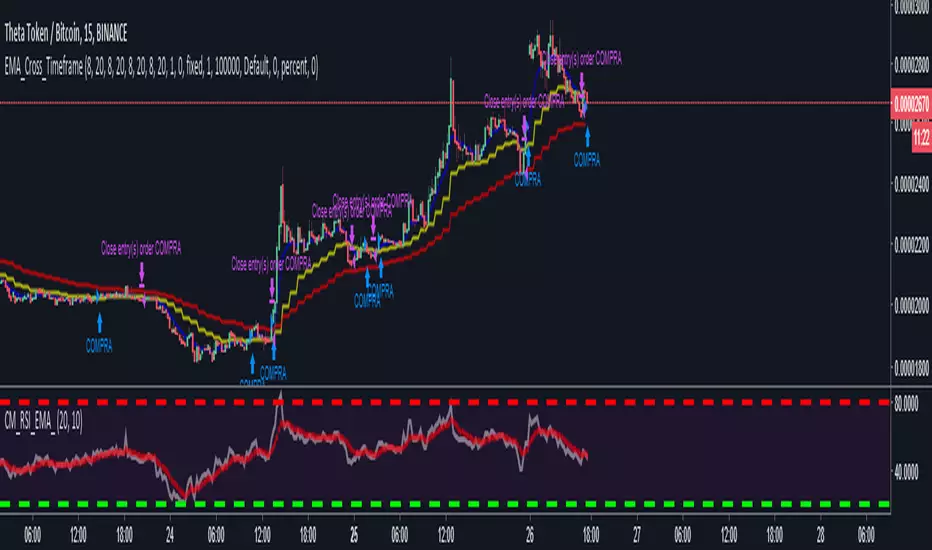
Indicator made to show the EMAs in different timeframes.
indicator gives buys signal when the EMA of the current chart (emaA1) crosses the EMA of the 1H chart (emaH1). And it gives the signal of sale when the EMA of the current chart (emaA1), crosses down the EMA of the 1H chart (emaH1) and the closing is below the emaH1.
NOTE 1: In the tests that I have done, it has given great signs of purchase, but with the sales signals, I still have to find the best result.
NOTE 2: Do not blindly use any indicators, analyze them, and use the indicator to help confirm your inputs and outputs.
I am open to suggestions for improvements.
發行說明
Change made so that in the graph the BUY sign is shown as "COMPRA"Change made so that in the chart the SELL signal is shown as "VENDA"
發行說明
added sale signal if the current EMA crosses down from the 1H Now the sales signal is given in case the current media crosses below the 1He (with the closing price) or below the 1H B
發行說明
change made, from EMA to SMAnow the tool uses the simple SMA media furniture. I understand that this makes the result better.
受保護腳本
此腳本以閉源形式發佈。 不過,您可以自由使用,沒有任何限制 — 點擊此處了解更多。
免責聲明
這些資訊和出版物並非旨在提供,也不構成TradingView提供或認可的任何形式的財務、投資、交易或其他類型的建議或推薦。請閱讀使用條款以了解更多資訊。
免責聲明
這些資訊和出版物並非旨在提供,也不構成TradingView提供或認可的任何形式的財務、投資、交易或其他類型的建議或推薦。請閱讀使用條款以了解更多資訊。