INVITE-ONLY SCRIPT
TIL Volume by Price SR
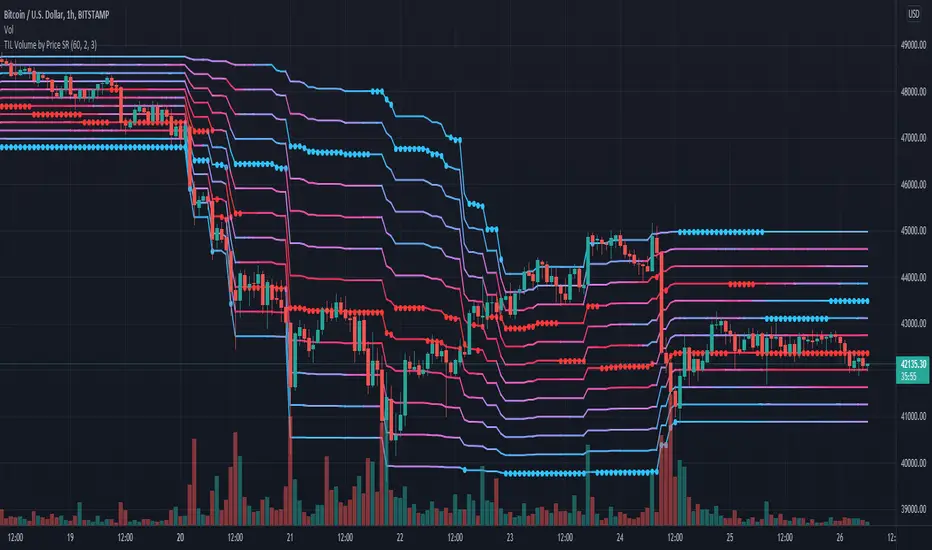
Trading Indicator Lab's Volume by Price SR is a volume-based indicator for TradingView that reveals the strongest (and weakest) support and resistance levels in the chart among 12 price zones within a given period.
How It Works
The Volume by Price indicator uses a spectrum of blue to red colors to differentiate the strength of the volume within a price range for each bar. Think of it as a running volume profile with 12 price zones.
For each bar, the indicator calculates the rank of each price zone from the one that has the least number of volume to the highest within a given length of bars. Price zones that have less volume count are assigned colors that are closer to blue while price zones that have higher volume appear red. The indicator also marks the highest and lowest price levels in the rank with a red and blue dot which correspond to the same color code. The indicator repeats this in the next bar up to the last until it creates a stream of 12 lines that visually represent the gradual shift of volume strength in the price axis.
How to Use
The Volume by Price SR indicator is simple and can be used primarily to gauge support and resistance. Red lines represent price levels where there is a history of higher volume within the period, which also act as good support/resistance levels where price is more likely to be tested or bounce off.
As it can also be seen as a running volume profile indicator, the red and blue dots in each bar can be considered as high volume nodes (HVN) and low volume nodes (LVN) respectively. Though the calculation of the volume profile is continuous, the HVN and LVN dots can often appear consecutively or in a series within a single price level. The price tends to linger around or test lines that has the red dot (HVN). Meanwhile price rarely cross lines with the blue dot (LVN) or not spend as much time in these areas compared to other levels.
The height of the 12 price zones is determined by the difference between the highest high and lowest low of the period which can be useful in visualizing the chart's dynamic price range.
Inputs
- Length - sets the length of the period the indicator calculates for each bar
- Line Thickness - sets the thickness of the 12 lines all at once
- Dot Size - sets the size of the HVN and LVN dots
僅限邀請腳本
只有經作者批准的使用者才能訪問此腳本。您需要申請並獲得使用權限。該權限通常在付款後授予。如欲了解更多詳情,請依照以下作者的說明操作,或直接聯絡tradingindicatorlab。
除非您完全信任其作者並了解腳本的工作原理,否則TradingView不建議您付費或使用腳本。您也可以在我們的社群腳本中找到免費的開源替代方案。
作者的說明
Please feel free to send us a private message here on TradingView to gain access to this indicator.
提醒:在請求訪問權限之前,請閱讀僅限邀請腳本指南。
免責聲明
這些資訊和出版物並不意味著也不構成TradingView提供或認可的金融、投資、交易或其他類型的意見或建議。請在使用條款閱讀更多資訊。