INVITE-ONLY SCRIPT
HIPA - High IRL Probability Areas [Pro]
Overview
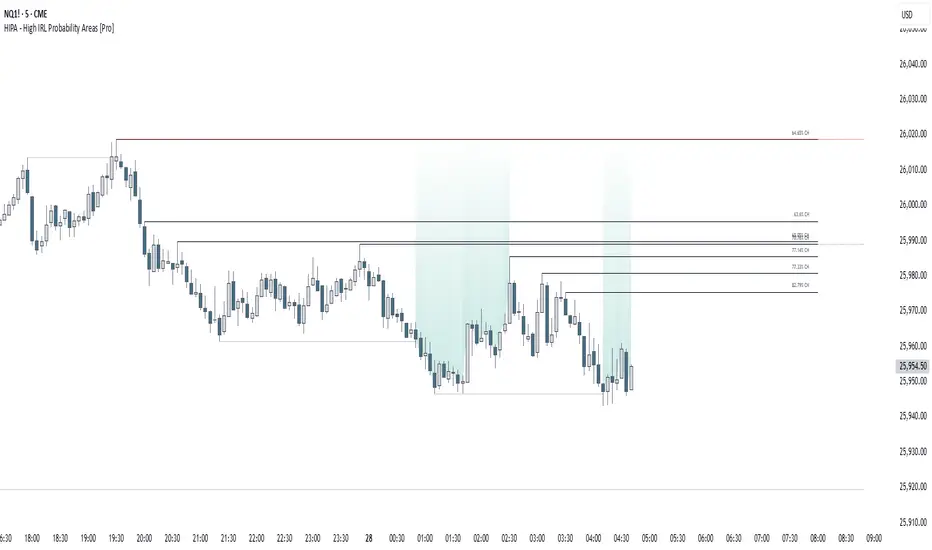
HIPA (High IRL Probability Areas) visualizes statistically derived Internal Range Liquidity (IRL) zones — price areas that have historically shown a higher tendency for revisit or interaction within an intraday session.
When a candle breaks a higher-timeframe reference bar’s high or low, HIPA plots a draw line at the opposite extreme of that bar, highlighting where liquidity is most likely to rest.
Each line displays a live, time-conditioned probability (CH) of being revisited before session end, plus an optional End-of-Day (EOD) probability.
HIPA provides statistical context on how current price interacts with prior structural ranges. It does not issue trade signals or forecasts.
Key Features
• Tracks higher-timeframe reference bars across the session.
• Plots draw lines at the opposite extreme once a break occurs.
• Displays dynamic CH and optional EOD probabilities derived from embedded historical statistics.
• Tested lines change style once price interacts; expired levels are automatically removed.
• Fully customizable palette, text size, and visibility options.


Signal Area Context
HIPA includes an optional Signal Area overlay that blends IRL probabilities with higher-timeframe (HTF) structure.
You can reference candle highs/lows or pivots from selected HTF intervals and display a subtle gradient between these external liquidity points and active IRL zones.
The shaded area is intended to help visualize where intraday behavior aligns with multi-timeframe liquidity zones — not to produce entries or exits.
Traders may use it to study how price develops around these confluence regions.

Methodology (transparency)
HIPA uses embedded statistical references derived from long-term historical market behavior to estimate revisit probabilities conditioned by time-of-day and break direction.
These references are stored directly within the script for deterministic plotting — no external data is fetched or required.
Session data is internally organized into consistent time segments to reflect how revisit tendencies vary through the day.
HIPA is descriptive: it visualizes empirically observed behavior, not predictive outcomes.
How to Use
- Apply HIPA to any intraday chart.
- Observe when price breaks a higher-timeframe candle’s high or low — a draw line appears at the opposite extreme with CH/EOD labels.
- Optionally enable the Signal Area to visualize overlap between HTF liquidity and current IRL zones.
- Use HIPA as structural and statistical context only; combine with your own framework for decision-making.
- Treat draw lines and gradients as reference areas rather than precise trade levels.
Notes
• Historical behavior can evolve under different market conditions.
• CH/EOD probabilities adjust with session time; interpret contextually.
• Rendering many lines simultaneously may affect performance — enable pruning if needed.
• Works on any symbol or timeframe supported by TradingView.
Disclaimers
Educational use only. Past performance does not guarantee future results.
HIPA visualizes statistical context based on historical behavior and does not predict or recommend trades.
HIPA (High IRL Probability Areas) visualizes statistically derived Internal Range Liquidity (IRL) zones — price areas that have historically shown a higher tendency for revisit or interaction within an intraday session.
When a candle breaks a higher-timeframe reference bar’s high or low, HIPA plots a draw line at the opposite extreme of that bar, highlighting where liquidity is most likely to rest.
Each line displays a live, time-conditioned probability (CH) of being revisited before session end, plus an optional End-of-Day (EOD) probability.
HIPA provides statistical context on how current price interacts with prior structural ranges. It does not issue trade signals or forecasts.
Key Features
• Tracks higher-timeframe reference bars across the session.
• Plots draw lines at the opposite extreme once a break occurs.
• Displays dynamic CH and optional EOD probabilities derived from embedded historical statistics.
• Tested lines change style once price interacts; expired levels are automatically removed.
• Fully customizable palette, text size, and visibility options.
Signal Area Context
HIPA includes an optional Signal Area overlay that blends IRL probabilities with higher-timeframe (HTF) structure.
You can reference candle highs/lows or pivots from selected HTF intervals and display a subtle gradient between these external liquidity points and active IRL zones.
The shaded area is intended to help visualize where intraday behavior aligns with multi-timeframe liquidity zones — not to produce entries or exits.
Traders may use it to study how price develops around these confluence regions.
Methodology (transparency)
HIPA uses embedded statistical references derived from long-term historical market behavior to estimate revisit probabilities conditioned by time-of-day and break direction.
These references are stored directly within the script for deterministic plotting — no external data is fetched or required.
Session data is internally organized into consistent time segments to reflect how revisit tendencies vary through the day.
HIPA is descriptive: it visualizes empirically observed behavior, not predictive outcomes.
How to Use
- Apply HIPA to any intraday chart.
- Observe when price breaks a higher-timeframe candle’s high or low — a draw line appears at the opposite extreme with CH/EOD labels.
- Optionally enable the Signal Area to visualize overlap between HTF liquidity and current IRL zones.
- Use HIPA as structural and statistical context only; combine with your own framework for decision-making.
- Treat draw lines and gradients as reference areas rather than precise trade levels.
Notes
• Historical behavior can evolve under different market conditions.
• CH/EOD probabilities adjust with session time; interpret contextually.
• Rendering many lines simultaneously may affect performance — enable pruning if needed.
• Works on any symbol or timeframe supported by TradingView.
Disclaimers
Educational use only. Past performance does not guarantee future results.
HIPA visualizes statistical context based on historical behavior and does not predict or recommend trades.
僅限邀請腳本
僅作者批准的使用者才能訪問此腳本。您需要申請並獲得使用許可,通常需在付款後才能取得。更多詳情,請依照作者以下的指示操作,或直接聯絡LevelLogic。
TradingView不建議在未完全信任作者並了解其運作方式的情況下購買或使用腳本。您也可以在我們的社群腳本中找到免費的開源替代方案。
作者的說明
For access, DM @LevelLogic on TradingView. Please do not request access in comments. Remove / re-add after updates to refresh.
免責聲明
這些資訊和出版物並非旨在提供,也不構成TradingView提供或認可的任何形式的財務、投資、交易或其他類型的建議或推薦。請閱讀使用條款以了解更多資訊。