PROTECTED SOURCE SCRIPT
已更新 Tradveller Pivot
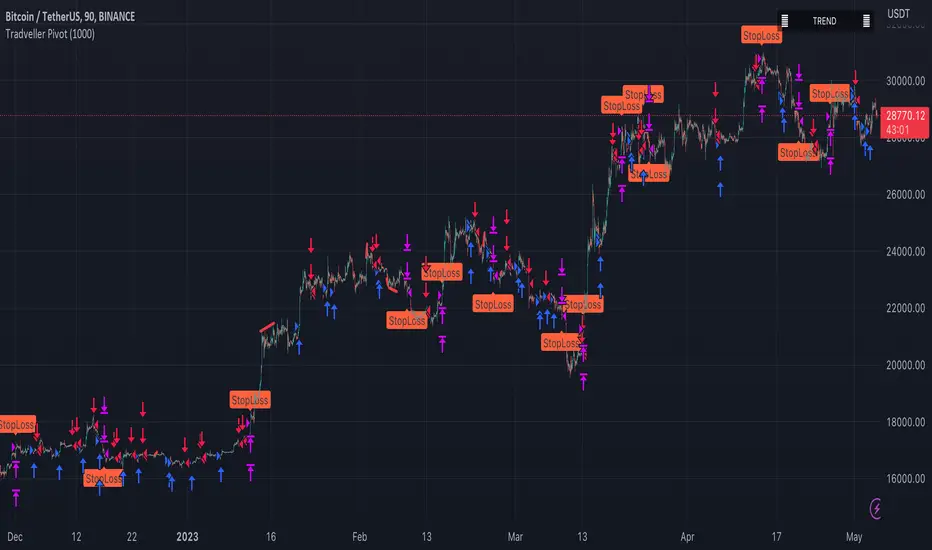
A pivot strategy is a trading technique that involves identifying key price levels, called pivot points, where a financial instrument is likely to experience a change in direction. Pivot points serve as potential support and resistance levels, which can help traders make informed decisions on when to enter or exit positions, set stop-loss or take-profit orders, and gauge market sentiment.
The pivot point itself is calculated using the high, low, and closing prices of the previous trading period (usually daily, but it can be applied to any timeframe). Once the pivot point is determined, additional support and resistance levels can be calculated around it. There are several methods to calculate these levels, with the most common being the classic, Woodie's, Camarilla, and Fibonacci methods.
A pivot strategy usually involves the following steps:
Calculate the pivot point and support and resistance levels using one of the methods mentioned above.
Observe the market price action and identify if the price is trading above or below the pivot point. If the price is above the pivot point, it indicates bullish sentiment, while trading below the pivot point suggests bearish sentiment.
Use the support and resistance levels to identify potential entry and exit points. Traders might consider buying when the price approaches a support level and selling when it approaches a resistance level.
Set stop-loss orders and take-profit targets based on the calculated levels, ensuring proper risk management.
Pivot strategies can be used in various market conditions and timeframes, and they often work well in combination with other technical analysis tools and indicators. However, like any trading strategy, it's essential to use proper risk management techniques and understand that no strategy guarantees success in every trade.
發行說明
A pivot strategy is a trading technique that involves identifying key price levels, called pivot points, where a financial instrument is likely to experience a change in direction. Pivot points serve as potential support and resistance levels, which can help traders make informed decisions on when to enter or exit positions, set stop-loss or take-profit orders, and gauge market sentiment.The pivot point itself is calculated using the high, low, and closing prices of the previous trading period (usually daily, but it can be applied to any timeframe). Once the pivot point is determined, additional support and resistance levels can be calculated around it. There are several methods to calculate these levels, with the most common being the classic, Woodie's, Camarilla, and Fibonacci methods.
A pivot strategy usually involves the following steps:
Calculate the pivot point and support and resistance levels using one of the methods mentioned above.
Observe the market price action and identify if the price is trading above or below the pivot point. If the price is above the pivot point, it indicates bullish sentiment, while trading below the pivot point suggests bearish sentiment.
Use the support and resistance levels to identify potential entry and exit points. Traders might consider buying when the price approaches a support level and selling when it approaches a resistance level.
Set stop-loss orders and take-profit targets based on the calculated levels, ensuring proper risk management.
Pivot strategies can be used in various market conditions and timeframes, and they often work well in combination with other technical analysis tools and indicators. However, like any trading strategy, it's essential to use proper risk management techniques and understand that no strategy guarantees success in every trade.
受保護腳本
此腳本以閉源形式發佈。 不過,您可以自由使用,沒有任何限制 — 點擊此處了解更多。
在交易的世界裡沒有真理,在上帝的眼中也沒有隨機。
免責聲明
這些資訊和出版物並非旨在提供,也不構成TradingView提供或認可的任何形式的財務、投資、交易或其他類型的建議或推薦。請閱讀使用條款以了解更多資訊。
受保護腳本
此腳本以閉源形式發佈。 不過,您可以自由使用,沒有任何限制 — 點擊此處了解更多。
在交易的世界裡沒有真理,在上帝的眼中也沒有隨機。
免責聲明
這些資訊和出版物並非旨在提供,也不構成TradingView提供或認可的任何形式的財務、投資、交易或其他類型的建議或推薦。請閱讀使用條款以了解更多資訊。