PROTECTED SOURCE SCRIPT
Bonds RSI

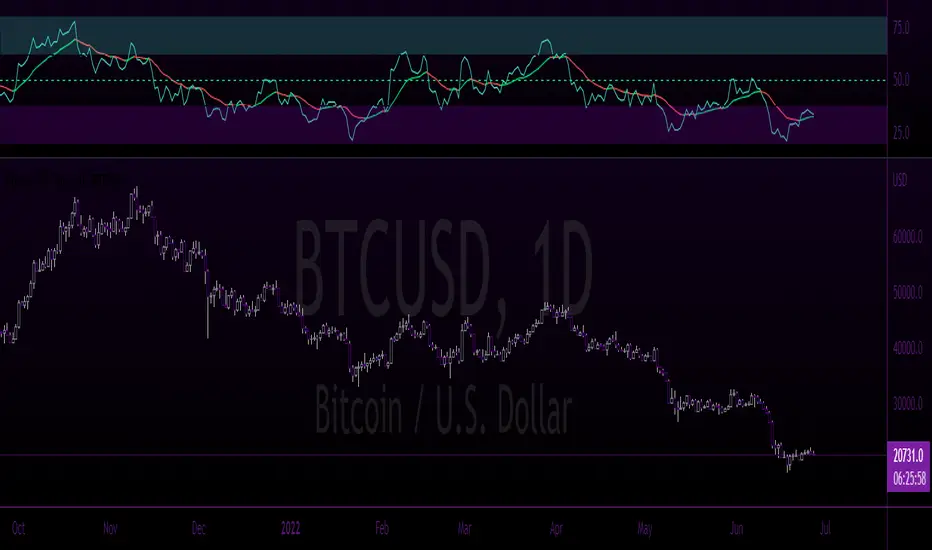
A visually appealing RSI indicator with "at a glance" visual cues to quickly and easily identify who is in control of the chart.
This indicator provides clear "Bull" and "Bear" control zones, as well as a built-in EMA that is color changing based on the trend direction.
All functions, specific data points and color themes are 100% customizable to allow the user the ability to tweak all aspects of this tool to their own liking.
As time allows I will be adding additional features & functions.
Please like & share this indicator if you find it useful.
受保護腳本
此腳本以閉源形式發佈。 不過,您可以自由使用,沒有任何限制 — 點擊此處了解更多。
免責聲明
這些資訊和出版物並非旨在提供,也不構成TradingView提供或認可的任何形式的財務、投資、交易或其他類型的建議或推薦。請閱讀使用條款以了解更多資訊。
受保護腳本
此腳本以閉源形式發佈。 不過,您可以自由使用,沒有任何限制 — 點擊此處了解更多。
免責聲明
這些資訊和出版物並非旨在提供,也不構成TradingView提供或認可的任何形式的財務、投資、交易或其他類型的建議或推薦。請閱讀使用條款以了解更多資訊。