PROTECTED SOURCE SCRIPT
已更新 Energy v1
Basic energy tracker
發行說明
Updated to include net energy movements發行說明
Improved model發行說明
Adding new methodology and smoothing發行說明
Added a signal line -- crossing the zero line indicates a potential top / bottom發行說明
Added new methodology發行說明
Addition of new method - average of High/Low/Close發行說明
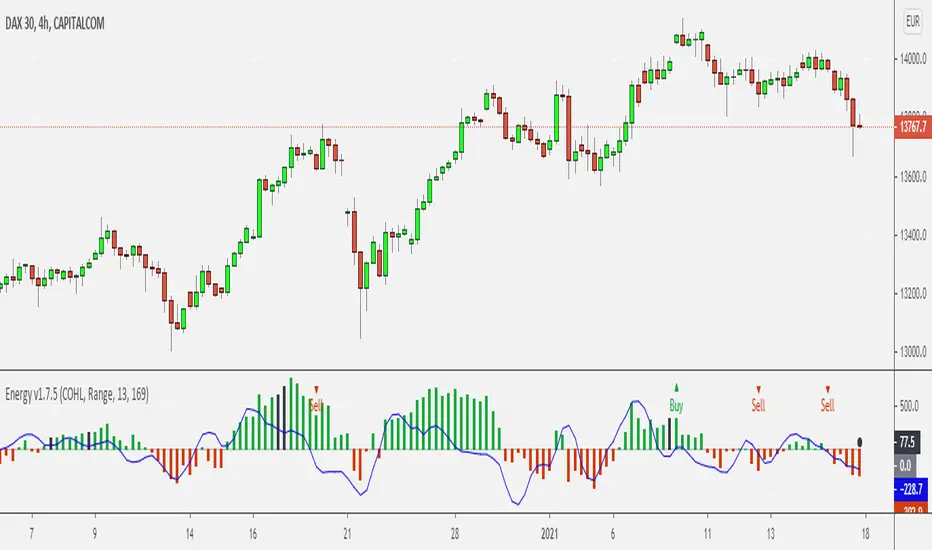
This script measures cumulative 'Energy' in a security built up over time where bulls add to the cumulative energy and bears reduce it. Changes to this cumulative energy result from the battle between bulls and bears and can give indications on major turning points as well as signals as to when to enter into a long or short trade. This indicator must be used in conjunction with other techniques.OUTPUTS:
Area chart: longer term cumulative energy model
Histogram: primary energy model where green positive bars indicate positive energy through the lookback period and red is negative
Line chart: signal line used to identify entry and exit points
INPUTS:
Source Data: Data series to use for calculation of energy changes (O=Open, H=High, L=Low, C=Close). Default O/H|L is best for most markets, but some highly trending or volatile markets may require a different methodology. User should experiment with a security and choose based on its effectiveness in the history
Methodology: Moving average or range based calculations through the lookback period.
Volume Weighted: Not usually significant but can be useful adjustment for securities with low liquidity levels
Show MA energy: Display alternative longer term methodology
USAGE:
Blue signal line is the most important indicator and changes from positive to negative or vice versa indicate potential entry and exit opportunities. Users should beware of divergence between the signal line and the energy pattern (histogram) for potential false positive signals.
For example when entering a long position, a good signal is when:
(1) signal line is crossing the zero from negative to positive
(2) energy has been rising consistently for past 3 candles
(3) energy moves into positive at the same time as signal line crosses
(4) longer term energy is increasing (area chart)
Users should avoid using this indicator for entry/exit decisions where there is an absense of a clear trend
User should also take caution where major peaks in long term energy occur which often indicate a period of sideways price movement and increased price volatility. This can be used as part of an options trading strategy but the author has not tested (next version!)
發行說明
Addition of a buy/sell indicator so that the user can check for potential turning points / direction changes in the market. The indicator should not be used in isolation but rather should be confirmed using other methodologies. Potential long position entries are indicated with a green 'Buy' and a potential short position with a red 'Sell'. NOTE: the indicators are designed to show ENTRY positions only. Exits and stop losses are not included in this version.
發行說明
Improved algorithm for identifying Buy and Sell signals for further analysis. No other changes in this version v1.7.1發行說明
1. Addition of new COHL methodology for energy calculation which is useful for high volatility securities2. Addition of checks for divergences in energy changes, with bars shown in black. Users should be cautious that the market may change direction (or reverse) on or near to a divergence candle
發行說明
Added Alert Condition with a title of "Buy/Sell Signal" so that the indicator can be used with the Tradingview Alerts.發行說明
Added a long term weighted average cumulative energy indicator that is shown on the last bar only. This indicator shows the user whether long term investors are still overall bullish or bearish and by how much and also forms a target for mean reversion受保護腳本
此腳本以閉源形式發佈。 不過,您可以自由使用,沒有任何限制 — 點擊此處了解更多。
免責聲明
這些資訊和出版物並非旨在提供,也不構成TradingView提供或認可的任何形式的財務、投資、交易或其他類型的建議或推薦。請閱讀使用條款以了解更多資訊。
免責聲明
這些資訊和出版物並非旨在提供,也不構成TradingView提供或認可的任何形式的財務、投資、交易或其他類型的建議或推薦。請閱讀使用條款以了解更多資訊。