PROTECTED SOURCE SCRIPT
已更新 CCI+MACD+VWAP+Breakout

Design for LONG and Day Trade only
- Identify buy and sell signal using CCI
- Green Zone when
-- Price over VWAP
-- EMA9 > EMA50 > EMA200
-- MACD fast > MACD slow
- Yellow Zone when either one failed
- White line occurs when breakout of Higher High + Higher Low
- Identify buy and sell signal using CCI
- Green Zone when
-- Price over VWAP
-- EMA9 > EMA50 > EMA200
-- MACD fast > MACD slow
- Yellow Zone when either one failed
- White line occurs when breakout of Higher High + Higher Low
發行說明
Design for LONG and Day Trade only- Identify buy and sell signal using CCI
- Green Zone when
-- Price over VWAP
-- EMA9 > EMA50 > EMA200
-- MACD fast > MACD slow
- Yellow Zone when either one failed
- White line occurs when breakout of Higher High + Higher Low
發行說明
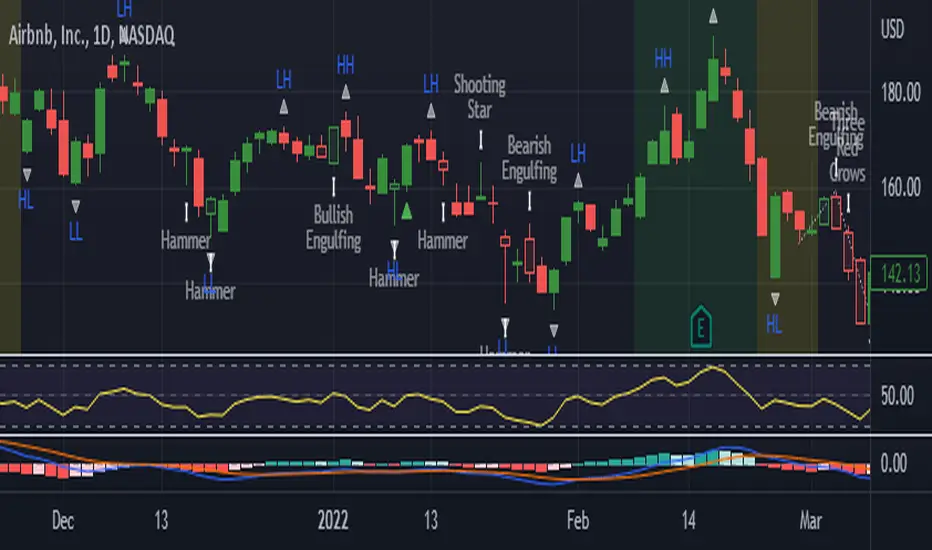
**** Design for Day Trade Only ****New Revision [2022-07-25]
- Show Breakout Signal (green triangle) after a higherhigh and a lowerhigh occur and volatility decreasing
- Show Candle Pattern Analysis with [on / off]
- Show the trendline with [on / off]
- Show HH, LH, LL, LH with [on / off]
- Yellow Zone (backgrand) when Moving average fast line crossover slow line
- Green Zone (backgrand) when Moving average fast line crossover slow line and MACD crossover and RSI <= 80
受保護腳本
此腳本以閉源形式發佈。 不過,您可以自由使用,沒有任何限制 — 點擊此處了解更多。
免責聲明
這些資訊和出版物並非旨在提供,也不構成TradingView提供或認可的任何形式的財務、投資、交易或其他類型的建議或推薦。請閱讀使用條款以了解更多資訊。
受保護腳本
此腳本以閉源形式發佈。 不過,您可以自由使用,沒有任何限制 — 點擊此處了解更多。
免責聲明
這些資訊和出版物並非旨在提供,也不構成TradingView提供或認可的任何形式的財務、投資、交易或其他類型的建議或推薦。請閱讀使用條款以了解更多資訊。