INVITE-ONLY SCRIPT
已更新 Reversal Indicator
Divergence Indicator
發行說明
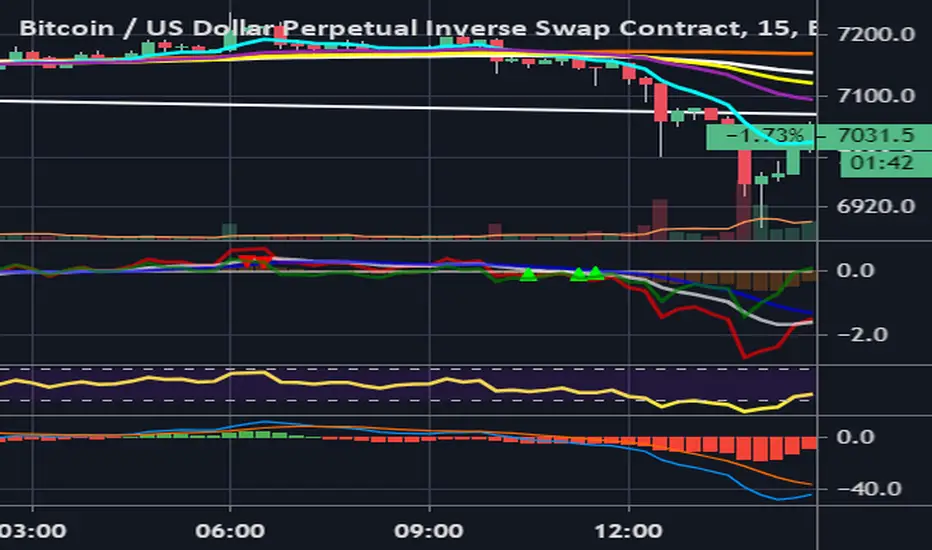
Indicator is similar to RSI, but isn't range bound (no maximum or minimum). Buy or sell signals are recognized, when connecting line of vertexes on the red line diverge with connecting line of vertexes on the green line. White line is lagging trend line (like MA). When it is above zero axis, it is signaling uptrend and vice versa. The strength of trend is measured by how the red line sustain above the white line and how often the two cross. Indicator can be used on all timeframes, but the higher the timeframe, the stronger the signal with less noise and the greater is the expected move. For example when there is a signal to sell on 1D, 12h and 8h timeframes, it is best to look for good entry signals on 1h, 30m and 15m. On small timeframes (1m - 5m) it works very well during high volatility and high volume periods. During low volume periods there is more noise.
Compared to RSI there are signals formed in times when there is no divergence on RSI.
發行說明
Added blue signal line發行說明
.發行說明
Added visual long and short signals.發行說明
Added alerts for long and short signals發行說明
Added histogram and signal line免責聲明
這些資訊和出版物並不意味著也不構成TradingView提供或認可的金融、投資、交易或其他類型的意見或建議。請在使用條款閱讀更多資訊。