PROTECTED SOURCE SCRIPT
1337PA
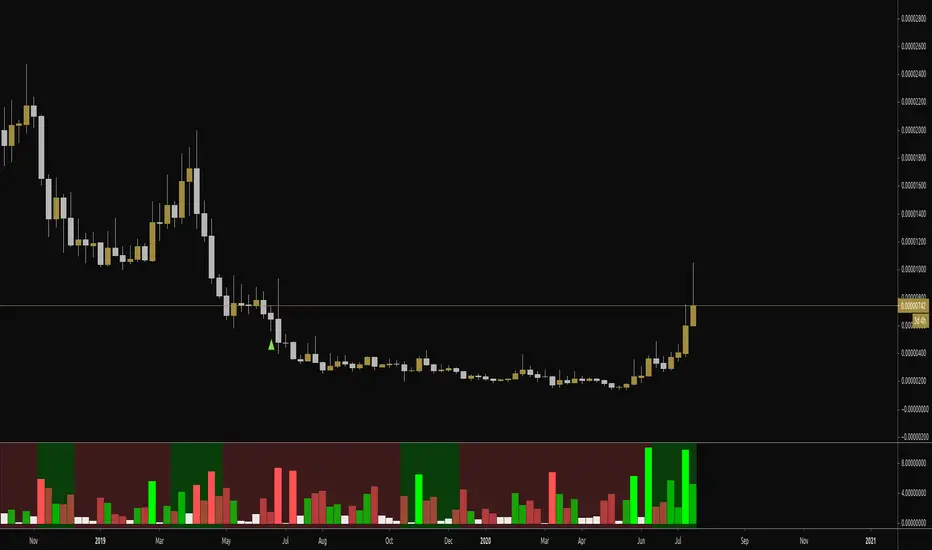
This script looks at % moves and uses z-scoring to highlight bars that are statistically significant in either direction.
The output columns values represent % moves within a trading period on an asset. The colors are explained below:
Lime - Significant
Bright red - Significant
Transparent lime - normal
Transparent red - normal
White - low %
It then uses a lookback function for a user-defined window and calculates the average % move on bullish bars and bearish bars.
When the average % move in the bullish direction over the lookback window becomes greater than the average % move in the bearish direction over the lookback window, it will highlight the background either green or red, signifying a trend in price.
It's a fantastic indicator to use in conjunction with

, which does similar things but for volume .
You can spot disparities in volume / price action and use that to inform trading decisions... for instance, a statistically significant volume day but a low significant PA day could provide some insight into the market.
You can also use the background (trend direction) in conjunction with the obv printout on 1337-Volume as multiple points of confirmation for trade decisions... i.e., volume and price action trend logic points to bearish or bullish outcome... or maybe price action is leaning bullish but volume suggests otherwise...
Enjoy!
The output columns values represent % moves within a trading period on an asset. The colors are explained below:
Lime - Significant
Bright red - Significant
Transparent lime - normal
Transparent red - normal
White - low %
It then uses a lookback function for a user-defined window and calculates the average % move on bullish bars and bearish bars.
When the average % move in the bullish direction over the lookback window becomes greater than the average % move in the bearish direction over the lookback window, it will highlight the background either green or red, signifying a trend in price.
It's a fantastic indicator to use in conjunction with
, which does similar things but for volume .
You can spot disparities in volume / price action and use that to inform trading decisions... for instance, a statistically significant volume day but a low significant PA day could provide some insight into the market.
You can also use the background (trend direction) in conjunction with the obv printout on 1337-Volume as multiple points of confirmation for trade decisions... i.e., volume and price action trend logic points to bearish or bullish outcome... or maybe price action is leaning bullish but volume suggests otherwise...
Enjoy!
受保護腳本
此腳本以閉源形式發佈。 不過,您可以自由使用,沒有任何限制 — 點擊此處了解更多。
免責聲明
這些資訊和出版物並非旨在提供,也不構成TradingView提供或認可的任何形式的財務、投資、交易或其他類型的建議或推薦。請閱讀使用條款以了解更多資訊。
受保護腳本
此腳本以閉源形式發佈。 不過,您可以自由使用,沒有任何限制 — 點擊此處了解更多。
免責聲明
這些資訊和出版物並非旨在提供,也不構成TradingView提供或認可的任何形式的財務、投資、交易或其他類型的建議或推薦。請閱讀使用條款以了解更多資訊。