OPEN-SOURCE SCRIPT
已更新 Sessions[Lenny Kiruthu]

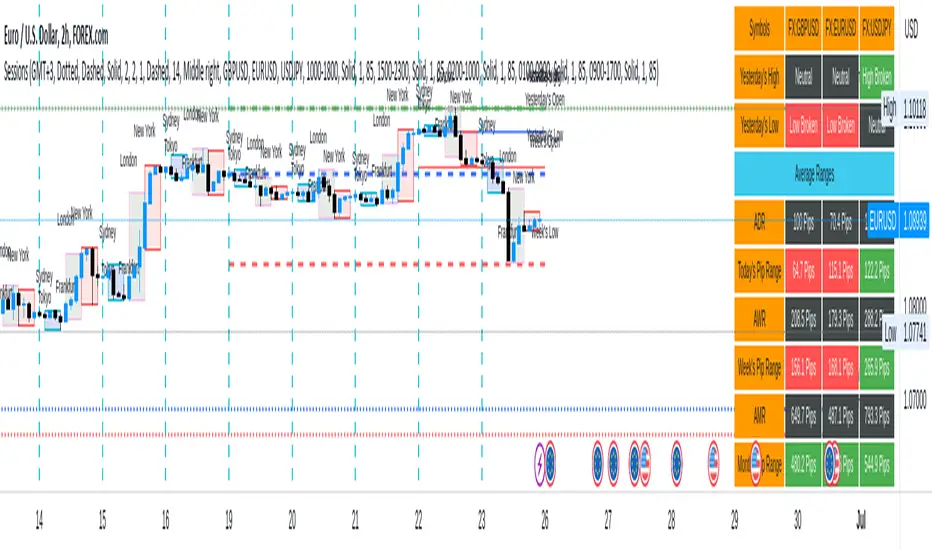
The script below is designed to show up to 4 different trading sessions i.e. London, New York, Tokyo and Sydney sessions, it also displays the days each session is taking place in as well as two horizontal lines one for the previous days high and the other for the previous days low.
It also displays a table that shows the user the highest and lowest price for 4 different currency pairs the previous day as well as their current prices and below it a confirmation row that shows whether price is currently above, below or within yesterdays range. Note that it only states "High Broken" or "Low Broken" if the current close is above or below the lines.
What you can change
- Your time zone for example GMT -4 or GMT +3
- The session start and end time
- The colors, border type and border width of the session ranges
- Displaying the table
- Ability to choose the 4 symbols to view on the table
發行說明
Version 2 [Sessions and Volatility]
So whats new:- Addition of the Frankfurt session to the indicator
- Addition of the monthly and weekly opens, highs and lows to create a depiction of top down analysis in one time frame.
- Addition of the average ranges[Average daily range, Average weekly range and Average monthly range] which is the average amount of pips you can expect a pair to make in a day, week of month. It has been designed to tell trades whether or not the market has moved too much in a particular day or not for example if the ADR for you chosen pair is 100 pips and the pair has moved more pips than that it might not be wise to trade. I've however only added this to guide you in your own decision making.
發行說明
So whats new:- Addition of the Frankfurt session to the indicator
- Addition of the monthly and weekly opens, highs and lows to create a depiction of top down analysis in one time frame.
- Addition of the average ranges which is the average amount of pips you can expect a pair to make in a day, week of month. It has been designed to tell trades whether or not the market has moved too much in a particular day or not for example if the ADR for you chosen pair is 100 pips and the pair has moved more pips than that it might not be wise to trade. I've however only added this to guide you in your own decision making.
發行說明
title change開源腳本
本著TradingView的真正精神,此腳本的創建者將其開源,以便交易者可以查看和驗證其功能。向作者致敬!雖然您可以免費使用它,但請記住,重新發佈程式碼必須遵守我們的網站規則。
免責聲明
這些資訊和出版物並不意味著也不構成TradingView提供或認可的金融、投資、交易或其他類型的意見或建議。請在使用條款閱讀更多資訊。
開源腳本
本著TradingView的真正精神,此腳本的創建者將其開源,以便交易者可以查看和驗證其功能。向作者致敬!雖然您可以免費使用它,但請記住,重新發佈程式碼必須遵守我們的網站規則。
免責聲明
這些資訊和出版物並不意味著也不構成TradingView提供或認可的金融、投資、交易或其他類型的意見或建議。請在使用條款閱讀更多資訊。