OPEN-SOURCE SCRIPT
已更新 Auto anchored VWAP Highest/Lowest Last 'n' bars
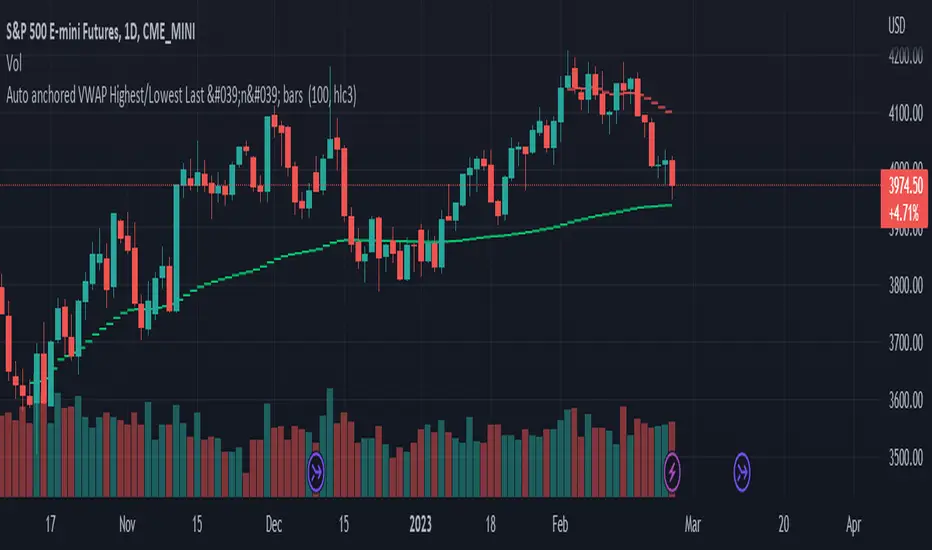
The VWAP (Volume Weighted Average Price) indicator is used to calculate the average price weighted by volume. This indicator is designed to automatically draw VWAPs from the highest and lowest points of the last 'n' bars.
It utilizes arrays to calculate the values of VWAP and plot it on the chart on the last historical bar. This version was coded to get a similar version to the official "VWAP Auto anchored" with the highest/lowest selected settings.
To use VWAP, traders can look for price movements relative to the VWAP line to identify potential support or resistance levels. It can also be used in conjunction with other technical indicators to develop trading strategies.
發行說明
Alert added 開源腳本
本著TradingView的真正精神,此腳本的創建者將其開源,以便交易者可以查看和驗證其功能。向作者致敬!雖然您可以免費使用它,但請記住,重新發佈程式碼必須遵守我們的網站規則。
Learning to trade and coding my strategies in Pine Script. Passing Prop Firms. DM me for any inquiries.
Buy me coffee at:
paypal : tabrejalam786007@gmail.com
BTC : 15zY6PUsrV55UQvcfaSqk5hJexKZAwhpcK
Buy me coffee at:
paypal : tabrejalam786007@gmail.com
BTC : 15zY6PUsrV55UQvcfaSqk5hJexKZAwhpcK
免責聲明
這些資訊和出版物並不意味著也不構成TradingView提供或認可的金融、投資、交易或其他類型的意見或建議。請在使用條款閱讀更多資訊。
開源腳本
本著TradingView的真正精神,此腳本的創建者將其開源,以便交易者可以查看和驗證其功能。向作者致敬!雖然您可以免費使用它,但請記住,重新發佈程式碼必須遵守我們的網站規則。
Learning to trade and coding my strategies in Pine Script. Passing Prop Firms. DM me for any inquiries.
Buy me coffee at:
paypal : tabrejalam786007@gmail.com
BTC : 15zY6PUsrV55UQvcfaSqk5hJexKZAwhpcK
Buy me coffee at:
paypal : tabrejalam786007@gmail.com
BTC : 15zY6PUsrV55UQvcfaSqk5hJexKZAwhpcK
免責聲明
這些資訊和出版物並不意味著也不構成TradingView提供或認可的金融、投資、交易或其他類型的意見或建議。請在使用條款閱讀更多資訊。