INVITE-ONLY SCRIPT
Rainbow Technometer - Multi Timeframe [WYCKOFF ARSENAL]
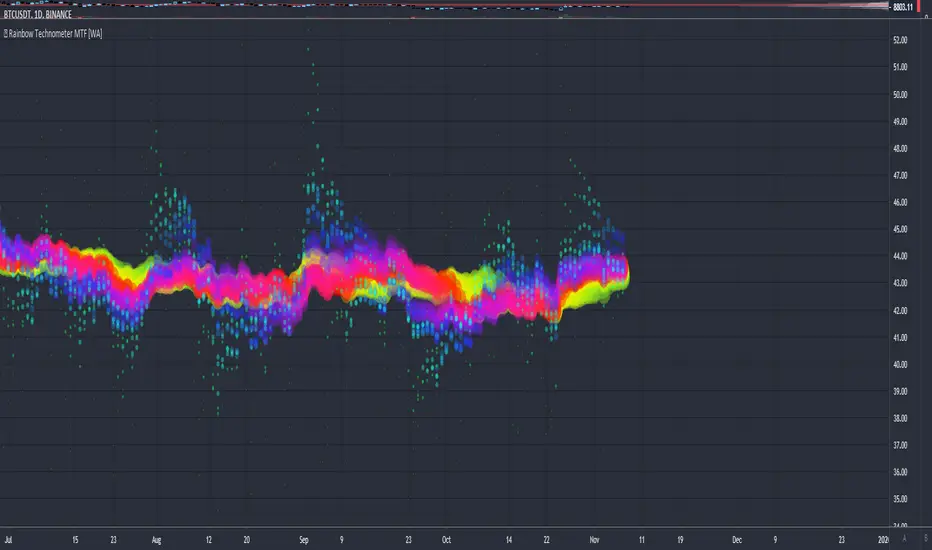
🌈 Rainbow Technometer - Multi Timeframe WYCKOFF ARSENAL
The purpose of the Technometer is to provide a mathematical indication of the degree to which the market is overbought or oversold.
The value of the Technometer could be as high as 100 or as low as 0. The other possible values would represent degrees of overbought or oversold.
In Rainbow form, the Technometer could also be used as a trend-following indicator.
The Rainbow Technometer can be used on any available timeframes and assets with volume data.
It is a combination of Technometer instances of different lengths that are plotted on the same chart.
The confluence zones can hint at a price reversal and help estimate the trend strength.
The Rainbow Technometer can be combined with other technical analysis tools as a trend-following indicator.
When the trend is strong and the other indicators used to determine entry points send a bullish or a bearish signal, a position can be opened.
When the trend is weak, opening new positions should not be to consider.
The Rainbow Technometer can also be used on its own. The angles of the Rainbow will hint at the trend strength.
The steeper the curve, the stronger the trend. The flatter the curve, the weaker the trend.
A Buy position can be opened in the beginning of a strong positive trend.
A Sell position can be opened in the beginning of a strong negative trend.
During a strong trend, short-lived retracements can be found, and it is possible to enter a position in the direction of the general trend against the retracement.
The Rainbow mode can be experienced with the Multi RSI indicator as well.
Related tools:
▪ Optimism Pessimism
▪ Force
- 🌈 Rainbow Force
▪ Technometer
- 🌈 Rainbow Technometer ◄
▪ Momentum
- 🌈 Rainbow Momentum
▪ Market Screener
僅限邀請腳本
僅作者批准的使用者才能訪問此腳本。您需要申請並獲得使用許可,通常需在付款後才能取得。更多詳情,請依照作者以下的指示操作,或直接聯絡KryptoNight。
TradingView不建議在未完全信任作者並了解其運作方式的情況下購買或使用腳本。您也可以在我們的社群腳本中找到免費的開源替代方案。
作者的說明
Join the Discord Server for more info about the published tools.
discord.io/CryptoWorld
a Discord bot for Charting (TradingView and Heatmaps) is available
🟣 If you like any of my Invite-Only Tools, let me know
(DM or Discord for inquiries)
discord.io/CryptoWorld
a Discord bot for Charting (TradingView and Heatmaps) is available
🟣 If you like any of my Invite-Only Tools, let me know
(DM or Discord for inquiries)
免責聲明
這些資訊和出版物並非旨在提供,也不構成TradingView提供或認可的任何形式的財務、投資、交易或其他類型的建議或推薦。請閱讀使用條款以了解更多資訊。