PROTECTED SOURCE SCRIPT
已更新 Trinity Trend Direction Pro
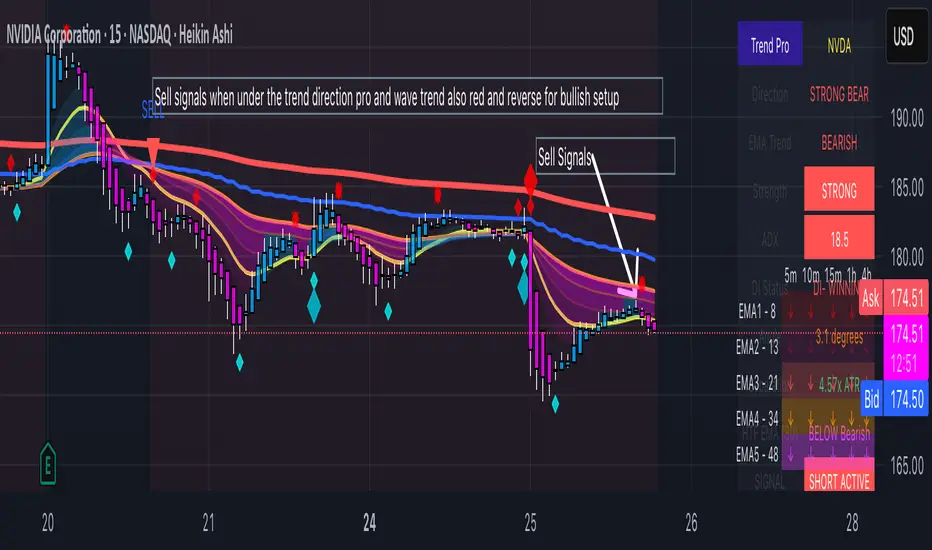
The Trinity Trend Pro is a no-nonsense trend filter indicator built around the classic 13 / 48 / 200 EMA stack, but massively upgraded with real intelligence. Instead of just drawing three lines and spamming crossovers like every other EMA script, it only speaks when a genuine, high-reward trend is actually happening. It combines three strict conditions that must all be true at the same time: perfect bullish or bearish EMA alignment, steep slope on all three EMAs (measured in degrees), and wide enough separation between the fast and slow EMA (normalized by ATR). If any of those fail, it stays silent. This eliminates almost all the fakeouts and chop that destroy most traders using regular EMA crossovers.
What makes it truly different is the built-in “trend exhaustion” logic: when the EMAs compress and start braiding (common after a big move), the indicator automatically switches to a neutral “FLAT” state and clears the previous signal instead of stubbornly staying green or red. It also supports an optional higher-timeframe EMA filter (you choose the timeframe and length) so you never fight the bigger trend. One clean arrow appears only when a brand-new strong trend begins, and it stays off the chart until the next real move — no arrow spam.
The background colors the entire chart lightly green or red while the trend is alive, and a compact dashboard in the corner tells you in plain English whether to be long, short, or flat.
How to use it is dead simple: add it to any chart (SPX, BTC, ES, Nasdaq, stocks, anything), look at the dashboard or background color, and only trade when it says “LONG ACTIVE” or “SHORT ACTIVE”. Green arrow + green background = go long (calls, futures, shares). Red arrow + red background = go short (puts or short). Anything else = stay out. Set the two built-in alerts (“NEW BULL TREND” and “NEW BEAR TREND”) and you’ll get notified the exact moment a fresh high-probability move starts. That’s literally all you need to do. No second-guessing, no overthinking, no getting chopped up in sideways markets. In our humble opinion it is one of the cleanest, smartest, most disciplined EMA-based tool on TradingView — designed for traders who are tired of noise and only want the real moves.
發行說明
The dashboard used to be too strict — it demanded perfect alignment, super-steep angles on all three EMAs, and wide separation at the exact same moment. In real markets (especially crypto), that almost never happens instantly, so even when price was clearly ripping higher, it stayed stuck on “FLAT / WAIT” with no background color, no signal, and no arrow.We changed the core logic so a strong trend is now recognized the moment you have proper EMA alignment + enough separation (the two things that actually matter most). Slope is still measured and shown, but it no longer blocks the signal. The result: as soon as a real move starts, the dashboard instantly flips to STRONG BULL / LONG ACTIVE, background turns green, and you get one clean arrow.
We also made the trend exhaustion smarter — when the EMAs compress again (move ends), it quickly returns to neutral instead of staying locked on the old direction forever.
Higher-timeframe EMA now works on every timeframe (1min to Daily) using safe, automatic resolution so it never breaks.
ADX + DI section is fully functional with proper strength coloring and crossover warnings.
Arrows are clean (one per trend), fully customizable in size and color, and alerts fire exactly once when a new strong trend begins.
Everything updates in real time, matches what your eyes see on the chart, and never gets stuck again. That’s it — it’s now one of the cleanest, most accurate, and most practical 13/48/200 EMA + ADX dashboard on TradingView. No fluff, no lag, no fakeouts. Just pure, high-reward trend confirmation
發行說明
Added the ability to manually change the higher time frame and value, also added notes and hints to all the settings to make it easier to change and tweak as desired, made all settings more adjustable. Enjoy and win win win...發行說明
Updating a small error. 受保護腳本
此腳本以閉源形式發佈。 不過,您可以自由使用,沒有任何限制 — 點擊此處了解更多。
免責聲明
這些資訊和出版物並非旨在提供,也不構成TradingView提供或認可的任何形式的財務、投資、交易或其他類型的建議或推薦。請閱讀使用條款以了解更多資訊。
受保護腳本
此腳本以閉源形式發佈。 不過,您可以自由使用,沒有任何限制 — 點擊此處了解更多。
免責聲明
這些資訊和出版物並非旨在提供,也不構成TradingView提供或認可的任何形式的財務、投資、交易或其他類型的建議或推薦。請閱讀使用條款以了解更多資訊。