OPEN-SOURCE SCRIPT
Delivery Volume Indicator
Delivery Volume Indicator
The Delivery Volume Indicator is designed to provide insights into trading volume specifically delivered on a daily basis, scaled in lakhs (hundreds of thousands) for ease of interpretation. This tool can be especially useful for traders looking to monitor delivery-based volume changes and trends, as it helps to distinguish between bullish and bearish volume flows.
Key Features:
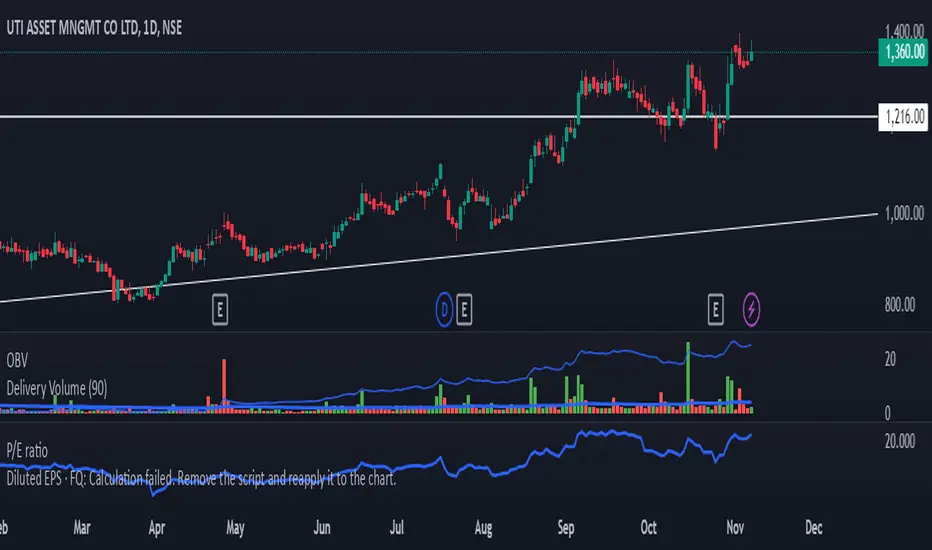
Daily Volume in Lakhs: The indicator pulls daily volume data and scales it to lakhs for more readable values.
Bullish/Bearish Color Coding: The indicator color-codes volume columns to reflect market sentiment. Columns are displayed in green when the price closes higher than it opens (bullish) and in red when the price closes lower than it opens (bearish).
Adjustable EMA: A customizable Exponential Moving Average (EMA) is applied to the scaled delivery volume. The EMA line, displayed in blue, helps smooth out volume trends and allows traders to adjust the period for personal strategy alignment.
How to Use:
Observe the delivery volume changes to track market sentiment over time. Increased bullish delivery volume could indicate accumulating interest, while increased bearish delivery volume might suggest distribution.
Utilize the EMA to identify longer-term trends in delivery volume, with shorter EMA periods for quick volume shifts and longer periods for gradual trend changes.
This indicator is ideal for traders seeking volume-based insights that align closely with price action.
The Delivery Volume Indicator is designed to provide insights into trading volume specifically delivered on a daily basis, scaled in lakhs (hundreds of thousands) for ease of interpretation. This tool can be especially useful for traders looking to monitor delivery-based volume changes and trends, as it helps to distinguish between bullish and bearish volume flows.
Key Features:
Daily Volume in Lakhs: The indicator pulls daily volume data and scales it to lakhs for more readable values.
Bullish/Bearish Color Coding: The indicator color-codes volume columns to reflect market sentiment. Columns are displayed in green when the price closes higher than it opens (bullish) and in red when the price closes lower than it opens (bearish).
Adjustable EMA: A customizable Exponential Moving Average (EMA) is applied to the scaled delivery volume. The EMA line, displayed in blue, helps smooth out volume trends and allows traders to adjust the period for personal strategy alignment.
How to Use:
Observe the delivery volume changes to track market sentiment over time. Increased bullish delivery volume could indicate accumulating interest, while increased bearish delivery volume might suggest distribution.
Utilize the EMA to identify longer-term trends in delivery volume, with shorter EMA periods for quick volume shifts and longer periods for gradual trend changes.
This indicator is ideal for traders seeking volume-based insights that align closely with price action.
開源腳本
秉持TradingView一貫精神,這個腳本的創作者將其設為開源,以便交易者檢視並驗證其功能。向作者致敬!您可以免費使用此腳本,但請注意,重新發佈代碼需遵守我們的社群規範。
免責聲明
這些資訊和出版物並非旨在提供,也不構成TradingView提供或認可的任何形式的財務、投資、交易或其他類型的建議或推薦。請閱讀使用條款以了解更多資訊。
開源腳本
秉持TradingView一貫精神,這個腳本的創作者將其設為開源,以便交易者檢視並驗證其功能。向作者致敬!您可以免費使用此腳本,但請注意,重新發佈代碼需遵守我們的社群規範。
免責聲明
這些資訊和出版物並非旨在提供,也不構成TradingView提供或認可的任何形式的財務、投資、交易或其他類型的建議或推薦。請閱讀使用條款以了解更多資訊。