OPEN-SOURCE SCRIPT
Accumulation/Distribution
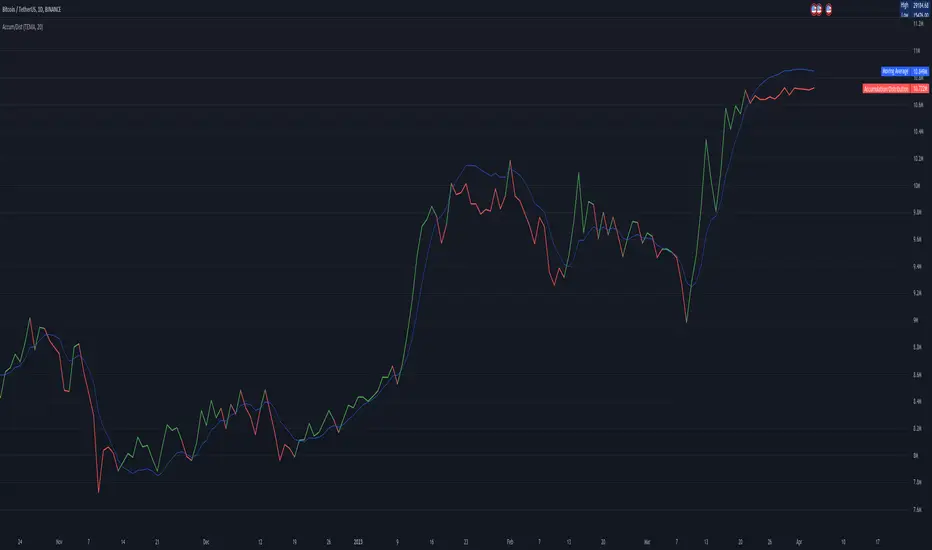
Accumulation/Distribution explains when the big players buy or sell, according to Wyckoff.
I added some colors to make it more visibly, to get a hint when (not) to invest.
A/D is a lagging indicator.
When the MA is above A/D line, this should reflect distribution time, and big players are selling.
The oppsite is when MA is below the A/D line, then this should be an accumulation phase, and big players are buying.
For example, my preference is a TEMA20 for crypto, this gives me good results.
But I added a bunch of moving averages to choose from.
Depending on preferences/marked you can choose a moving average, set its length, and you can choose all the colors too.
I recommend the Volume indicator to setup the MA line, and this will get much better results!

I hope this script will help some people to do some better decisions.
And I am pleased to get some advice to make this script even better!
There is only one similar-sounding script in the public section.
Kudos go to jbneto with his Accum/ Dist + 200 EMA which gave me the inspiration.
It has a EMA200, and its focus is on the daily pivot price.
I added some colors to make it more visibly, to get a hint when (not) to invest.
A/D is a lagging indicator.
When the MA is above A/D line, this should reflect distribution time, and big players are selling.
The oppsite is when MA is below the A/D line, then this should be an accumulation phase, and big players are buying.
For example, my preference is a TEMA20 for crypto, this gives me good results.
But I added a bunch of moving averages to choose from.
Depending on preferences/marked you can choose a moving average, set its length, and you can choose all the colors too.
I recommend the Volume indicator to setup the MA line, and this will get much better results!
I hope this script will help some people to do some better decisions.
And I am pleased to get some advice to make this script even better!
There is only one similar-sounding script in the public section.
Kudos go to jbneto with his Accum/ Dist + 200 EMA which gave me the inspiration.
It has a EMA200, and its focus is on the daily pivot price.
開源腳本
秉持TradingView一貫精神,這個腳本的創作者將其設為開源,以便交易者檢視並驗證其功能。向作者致敬!您可以免費使用此腳本,但請注意,重新發佈代碼需遵守我們的社群規範。
免責聲明
這些資訊和出版物並非旨在提供,也不構成TradingView提供或認可的任何形式的財務、投資、交易或其他類型的建議或推薦。請閱讀使用條款以了解更多資訊。
免責聲明
這些資訊和出版物並非旨在提供,也不構成TradingView提供或認可的任何形式的財務、投資、交易或其他類型的建議或推薦。請閱讀使用條款以了解更多資訊。