OPEN-SOURCE SCRIPT
已更新 RSI + Divergences + Alerts [MisterMoTA]

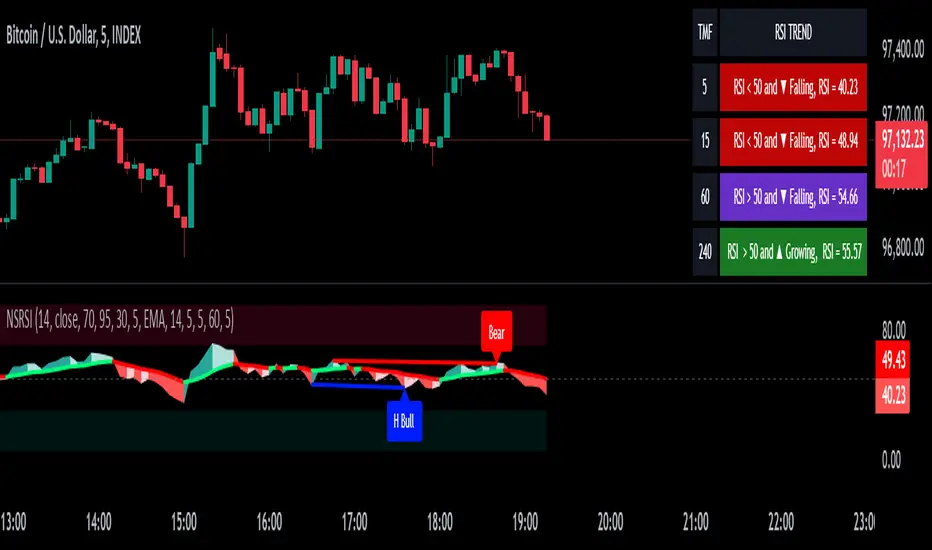
The indicator RSI + Divergences + Alerts by MisterMoTA is an RSI indicator that fills the RSI and RSI moving average with 4 different colors (growing up, falling up, falling down and rising down colors), users can customize colors from dashboard , also can be disabled the fill if the user want a standard RSI.
The dafault value of RSI is 14 and value of the moving average is 50 ( a dynamic 50 rsi line is better for trend identification than a standard 50 line) and users can change the values from indicator settings.
For detecting the divergences displayed in the indicator, I integrated in our script the default Divergences indicator from Tradingview, users can display, hide and change colors for regular and hidden divergences.
RSI indicator display also trend conditions for RSI and RSI MA, the RSI MA angle is calculated using ATR value, the slope of the RSI Noving Average can help to identify trend conditions too.

The script comes with 12 different alerts, if need different alerts please let me know in the comments and will update the script with your request:
Please follow me for other script like this one.
Kind regards,
MisterMoTA
The dafault value of RSI is 14 and value of the moving average is 50 ( a dynamic 50 rsi line is better for trend identification than a standard 50 line) and users can change the values from indicator settings.
For detecting the divergences displayed in the indicator, I integrated in our script the default Divergences indicator from Tradingview, users can display, hide and change colors for regular and hidden divergences.
RSI indicator display also trend conditions for RSI and RSI MA, the RSI MA angle is calculated using ATR value, the slope of the RSI Noving Average can help to identify trend conditions too.
The script comes with 12 different alerts, if need different alerts please let me know in the comments and will update the script with your request:
- Alert for Regular Bullish Divergence
- Alert for Regular Bearish Divergence
- Alert for Hidden Bullish Divergence
- Alert for Hidden Bearish Divergence
- Alert for RSI Overbought
- Alert for RSI Extreme Overbought
- "Alert for RSI Oversold
- Alert for RSI Extreme Oversold
- Alert for RSI Crossing Above RSI MA
- Alert for RSI Crossing Bellow RSI MA
- Alert for RSI Crossing Above 50
- Alert for RSI Crossing Bellow 50
Please follow me for other script like this one.
Kind regards,
MisterMoTA
發行說明
- Removed plotshape function from the divergence script as was generating warnings after latest pine script updates and replaced with label.new.
- Set the RSI Moving Average length to default 14, user can change the value to any value they want from dashboard (old default value was 50).
- Set the fill to false, if you like to add fill to rsi and MA just click on the checkbox from dashboard
- Added trend colors for RSI and RSI MA
- Added an RSI lenght 2 and an RSI length 5 with for an extra confirmation for trend direction, users can disable the rsi plots from dashboard.
- Added to plots of divergences "display = display.pane", so on scale divergences info to be hidden.
發行說明
- Deleted the moving average fill and the MA label from oscillator
- Added 3 Higher Tmeframes RSI labels in oscillator
- Added Input for second and third rsi (default they are hidden now)
- Added Bullish and Bearish zones and replaced default 40-60 levels
- Changed default MA type to RMA with a length of 7, as seems is the best setting for MA of the RSI, users can change it anyway to what values and types they want
發行說明
- back to basic simple form as part of rebranding all our indicators and strategies
- added ob and os fill areas
- added fill to rsi/ma
- changed rsi ma to default 14 ema
- removed the other rsi values, only default 14 rsi value kept
發行說明
- added var keyword to table to be displayed in real time the fields of the table and not to wait for close of candles before table rows will be displayed開源腳本
秉持TradingView一貫精神,這個腳本的創作者將其設為開源,以便交易者檢視並驗證其功能。向作者致敬!您可以免費使用此腳本,但請注意,重新發佈代碼需遵守我們的社群規範。
免責聲明
這些資訊和出版物並非旨在提供,也不構成TradingView提供或認可的任何形式的財務、投資、交易或其他類型的建議或推薦。請閱讀使用條款以了解更多資訊。
開源腳本
秉持TradingView一貫精神,這個腳本的創作者將其設為開源,以便交易者檢視並驗證其功能。向作者致敬!您可以免費使用此腳本,但請注意,重新發佈代碼需遵守我們的社群規範。
免責聲明
這些資訊和出版物並非旨在提供,也不構成TradingView提供或認可的任何形式的財務、投資、交易或其他類型的建議或推薦。請閱讀使用條款以了解更多資訊。