PROTECTED SOURCE SCRIPT
📊 Data Box Stat
สคริปต์ Pine Script ตัวนี้ (Data Box: Bullish/Bearish Streak & Max Position)
สคริปต์นี้จะสร้าง กล่องข้อมูล (data box) โชว์อยู่บนกราฟ TradingView
โดยจะแสดง:
จำนวนแท่งเขียว (ปิดบวก) ติดต่อกันล่าสุด (เช่น ปิด > ปิดแท่งก่อน)
จำนวนแท่งแดง (ปิดลบ) ติดต่อกันล่าสุด (ปิด < ปิดแท่งก่อน)
จำนวนแท่งเขียวที่ต่อเนื่องสูงสุดในอดีต (ตั้งแต่ต้นกราฟ)
จำนวนแท่งแดงที่ต่อเนื่องสูงสุดในอดีต
ผู้ใช้สามารถเลือกตำแหน่ง ที่จะแสดงกล่องข้อมูล (เช่น มุมขวาบน, กลางจอ, มุมซ้ายล่าง ฯลฯ) ได้จากหน้า Settings ของอินดิเคเตอร์
หลักการทำงานของสคริปต์
รับค่าตำแหน่งกล่องจากผู้ใช้
มีช่องให้เลือกตำแหน่งกล่องใน Setting (drop-down)
ค่าที่เลือก (เช่น "top_right") จะถูกแมปไปยังตำแหน่งจริงของตารางใน TradingView
คำนวณจำนวนแท่งเขียว/แดง ติดต่อกัน
ทุกแท่งใหม่จะเช็คว่า
ถ้าปิดบวกกว่าก่อนหน้า: เพิ่ม bullish streak +1, รีเซ็ต bearish streak
ถ้าปิดต่ำกว่าก่อนหน้า: เพิ่ม bearish streak +1, รีเซ็ต bullish streak
ถ้าปิดเท่ากัน: รีเซ็ตทั้งคู่
สคริปต์จะเก็บค่าสูงสุดของ streak ที่เคยเกิดขึ้น ตั้งแต่ต้นกราฟ (max streak)
สร้างกล่องแสดงผล (table)
กล่องข้อมูลจะถูกสร้างใหม่ เฉพาะตอนเปลี่ยนตำแหน่งเท่านั้น (ไม่สร้างใหม่ทุกบาร์)
ซึ่งช่วยให้เสถียรแม้ใช้ใน Timeframe ใหญ่ เช่น week หรือ month
แสดงผลบนกราฟ
----
This **“DATA BOX Dashboard”** indicator helps traders quickly understand how often the market closes up, down, or flat in a row — without needing to crunch numbers themselves.
- **Main purpose:** Tracks streaks of consecutive up closes, down closes, or unchanged closes, then displays them in a clean dashboard on the chart.
- **What it shows:**
- Longest streaks ever recorded for each type (up, down, flat)
- Number of days in each category and their percentages out of all days analyzed
- Current streak status (e.g., how many days in a row the market has closed up or down)
- A concise summary line that wraps everything together
- **Real-time view:** While a bar is still forming, it shows a “live status” (rising, falling, unchanged) along with the percentage change so far.
- **Signals:** Highlights when the current streak is approaching its historical average, giving context instead of predictions.
- **Customization:** Users can choose language (Thai/English), themes, fonts, colors, table position, and analysis period.
- **Alerts:** Can notify when a streak hits a chosen threshold or breaks a new record.
- **How to use:** It works on any symbol and timeframe. Use the dashboard as context to see whether current market behavior is “normal” compared to history, and combine it with your own trading strategy.
ตารางมี 3 แถว (หัวตาราง, ข้อมูล bullish, ข้อมูล bearish)
คอลัมน์: ชื่อ, จำนวนล่าสุด, จำนวนสูงสุด
ใช้สีแยกแต่ละแถวให้อ่านง่าย
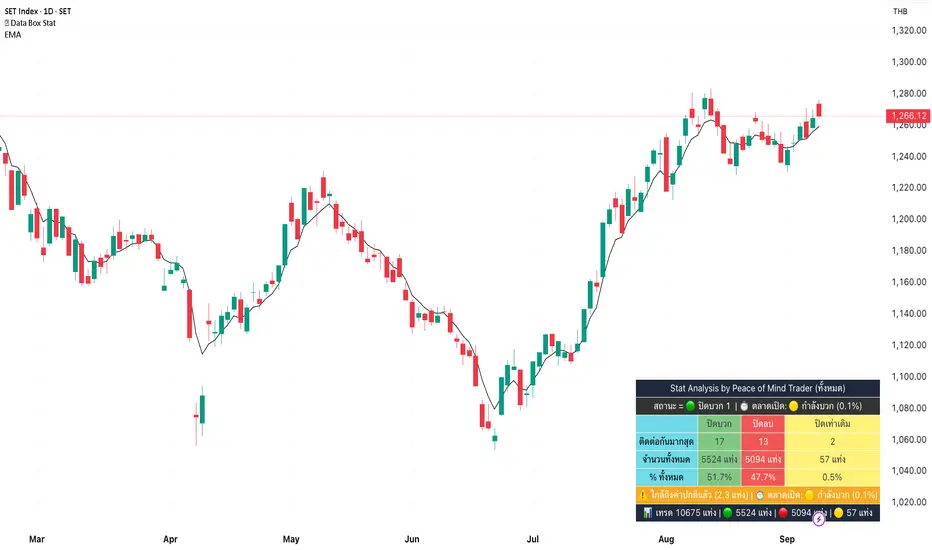
ผลลัพธ์บนกราฟ
จะเห็นกล่องข้อมูลที่มุม (หรือมุมที่เลือก)
บรรทัด "ปิดบวก": โชว์จำนวนแท่งเขียวล่าสุด และสูงสุด
บรรทัด "ปิดลบ": โชว์จำนวนแท่งแดงล่าสุด และสูงสุด
กล่องจะอัปเดตอัตโนมัติทุกบาร์
ตัวอย่างการใช้งาน
เพิ่มอินดิเคเตอร์นี้ในกราฟใดก็ได้
ตั้งค่าตำแหน่งกล่องใน Settings
เหมาะกับการดูพฤติกรรมราคา แนวโน้ม โมเมนตัม หรือสัญญาณ exhaustion
(ใช้ได้กับทุก Timeframe เช่น Day, Week, Month)
สคริปต์นี้จะสร้าง กล่องข้อมูล (data box) โชว์อยู่บนกราฟ TradingView
โดยจะแสดง:
จำนวนแท่งเขียว (ปิดบวก) ติดต่อกันล่าสุด (เช่น ปิด > ปิดแท่งก่อน)
จำนวนแท่งแดง (ปิดลบ) ติดต่อกันล่าสุด (ปิด < ปิดแท่งก่อน)
จำนวนแท่งเขียวที่ต่อเนื่องสูงสุดในอดีต (ตั้งแต่ต้นกราฟ)
จำนวนแท่งแดงที่ต่อเนื่องสูงสุดในอดีต
ผู้ใช้สามารถเลือกตำแหน่ง ที่จะแสดงกล่องข้อมูล (เช่น มุมขวาบน, กลางจอ, มุมซ้ายล่าง ฯลฯ) ได้จากหน้า Settings ของอินดิเคเตอร์
หลักการทำงานของสคริปต์
รับค่าตำแหน่งกล่องจากผู้ใช้
มีช่องให้เลือกตำแหน่งกล่องใน Setting (drop-down)
ค่าที่เลือก (เช่น "top_right") จะถูกแมปไปยังตำแหน่งจริงของตารางใน TradingView
คำนวณจำนวนแท่งเขียว/แดง ติดต่อกัน
ทุกแท่งใหม่จะเช็คว่า
ถ้าปิดบวกกว่าก่อนหน้า: เพิ่ม bullish streak +1, รีเซ็ต bearish streak
ถ้าปิดต่ำกว่าก่อนหน้า: เพิ่ม bearish streak +1, รีเซ็ต bullish streak
ถ้าปิดเท่ากัน: รีเซ็ตทั้งคู่
สคริปต์จะเก็บค่าสูงสุดของ streak ที่เคยเกิดขึ้น ตั้งแต่ต้นกราฟ (max streak)
สร้างกล่องแสดงผล (table)
กล่องข้อมูลจะถูกสร้างใหม่ เฉพาะตอนเปลี่ยนตำแหน่งเท่านั้น (ไม่สร้างใหม่ทุกบาร์)
ซึ่งช่วยให้เสถียรแม้ใช้ใน Timeframe ใหญ่ เช่น week หรือ month
แสดงผลบนกราฟ
----
This **“DATA BOX Dashboard”** indicator helps traders quickly understand how often the market closes up, down, or flat in a row — without needing to crunch numbers themselves.
- **Main purpose:** Tracks streaks of consecutive up closes, down closes, or unchanged closes, then displays them in a clean dashboard on the chart.
- **What it shows:**
- Longest streaks ever recorded for each type (up, down, flat)
- Number of days in each category and their percentages out of all days analyzed
- Current streak status (e.g., how many days in a row the market has closed up or down)
- A concise summary line that wraps everything together
- **Real-time view:** While a bar is still forming, it shows a “live status” (rising, falling, unchanged) along with the percentage change so far.
- **Signals:** Highlights when the current streak is approaching its historical average, giving context instead of predictions.
- **Customization:** Users can choose language (Thai/English), themes, fonts, colors, table position, and analysis period.
- **Alerts:** Can notify when a streak hits a chosen threshold or breaks a new record.
- **How to use:** It works on any symbol and timeframe. Use the dashboard as context to see whether current market behavior is “normal” compared to history, and combine it with your own trading strategy.
ตารางมี 3 แถว (หัวตาราง, ข้อมูล bullish, ข้อมูล bearish)
คอลัมน์: ชื่อ, จำนวนล่าสุด, จำนวนสูงสุด
ใช้สีแยกแต่ละแถวให้อ่านง่าย
ผลลัพธ์บนกราฟ
จะเห็นกล่องข้อมูลที่มุม (หรือมุมที่เลือก)
บรรทัด "ปิดบวก": โชว์จำนวนแท่งเขียวล่าสุด และสูงสุด
บรรทัด "ปิดลบ": โชว์จำนวนแท่งแดงล่าสุด และสูงสุด
กล่องจะอัปเดตอัตโนมัติทุกบาร์
ตัวอย่างการใช้งาน
เพิ่มอินดิเคเตอร์นี้ในกราฟใดก็ได้
ตั้งค่าตำแหน่งกล่องใน Settings
เหมาะกับการดูพฤติกรรมราคา แนวโน้ม โมเมนตัม หรือสัญญาณ exhaustion
(ใช้ได้กับทุก Timeframe เช่น Day, Week, Month)
受保護腳本
此腳本以閉源形式發佈。 不過,您可以自由使用,沒有任何限制 — 點擊此處了解更多。
免責聲明
這些資訊和出版物並非旨在提供,也不構成TradingView提供或認可的任何形式的財務、投資、交易或其他類型的建議或推薦。請閱讀使用條款以了解更多資訊。
受保護腳本
此腳本以閉源形式發佈。 不過,您可以自由使用,沒有任何限制 — 點擊此處了解更多。
免責聲明
這些資訊和出版物並非旨在提供,也不構成TradingView提供或認可的任何形式的財務、投資、交易或其他類型的建議或推薦。請閱讀使用條款以了解更多資訊。