PROTECTED SOURCE SCRIPT
New Price Highs/Lows (plotted on RSI)
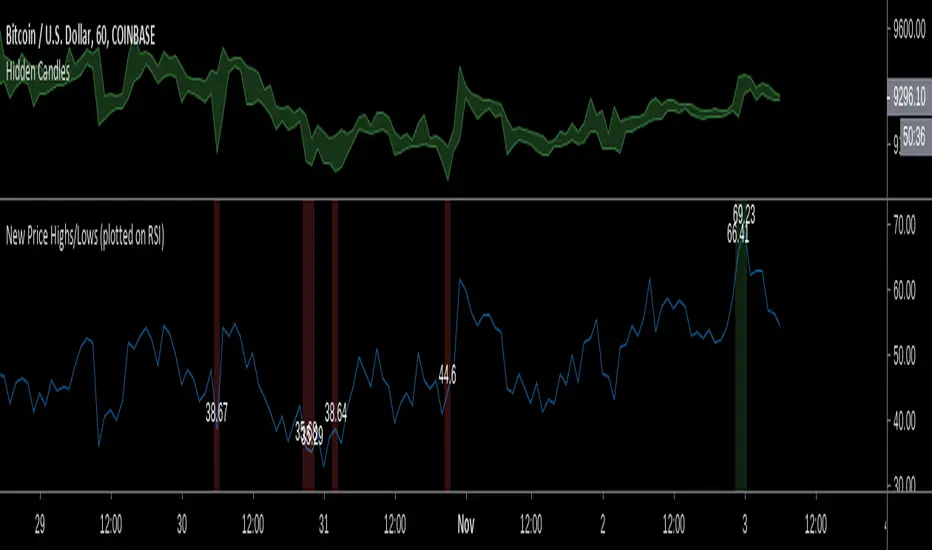
Rather than rely on existing indicators for bullish/bearish divergence, I'd rather just identify it myself.
This indicator just makes this easier to see (hands-free) the relevant data on the RSI at points where the price hits new highs/lows by colouring the background on the RSI based on price action and also plotting the RSI values at those points so you dont need to keep hovering over the RSI with your mouse.
Stay aware of your lookback setting because it will effect how often the new price highs/lows are highlighted.
受保護腳本
此腳本以閉源形式發佈。 不過,您可以自由且不受任何限制地使用它 — 在此處了解更多資訊。
免責聲明
這些資訊和出版物並不意味著也不構成TradingView提供或認可的金融、投資、交易或其他類型的意見或建議。請在使用條款閱讀更多資訊。
免責聲明
這些資訊和出版物並不意味著也不構成TradingView提供或認可的金融、投資、交易或其他類型的意見或建議。請在使用條款閱讀更多資訊。