OPEN-SOURCE SCRIPT
已更新 KINSKI ADX

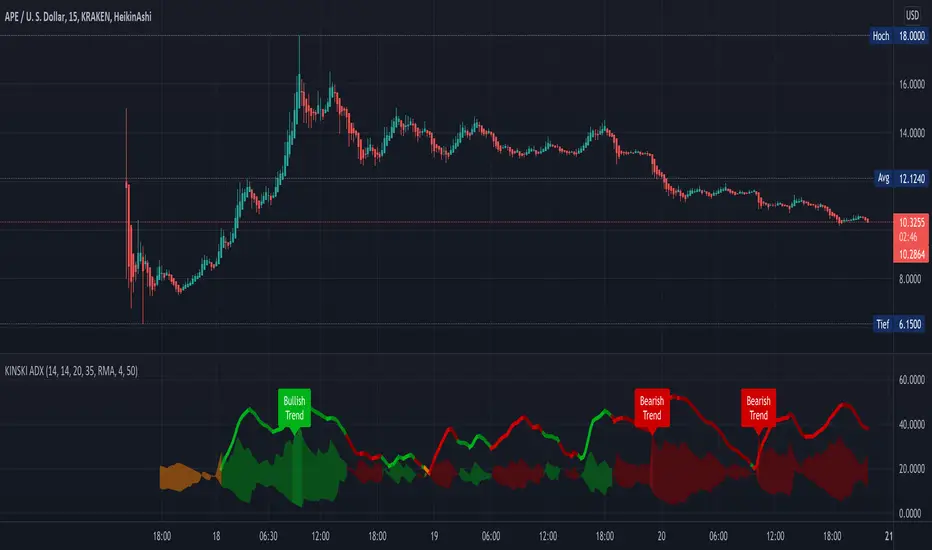
This ADX indicator (Average Directional Index) tries to estimate the strength of a trend. The Average Directional Index is derived from the positive (+DI) and the negative directional indicator (-DI). The direction of movement is determined by comparing the highs and lows of the current and past periods.
As soon as the indicator determines a trend strength for upward or downward trend, a label is displayed. An upward trend is labelled "Bullish Trend". The downward trend bears the label "Bearish Trend".
The clouds in the background represent the movements of the Average Directional Index High/Low:
The line represents the average value of the ADX signal:
The following configurable options are possible:
As soon as the indicator determines a trend strength for upward or downward trend, a label is displayed. An upward trend is labelled "Bullish Trend". The downward trend bears the label "Bearish Trend".
The clouds in the background represent the movements of the Average Directional Index High/Low:
- Color orange: neutral, uncertain in which direction it is going.
- Color green: upward trend
- Color red: downward trend
The line represents the average value of the ADX signal:
- Color orange: neutral: still uncertain in which direction it is going
- Color green / outgoing line: upward trend
- Color green / descending line: weakening upward trend
- Color red / exiting line: downward trend
- Color red / descending line: weakening downward trend
The following configurable options are possible:
- "ADX Smoothing
- Directional Index Length
- Level Range
- Level Trend
發行說明
Here's a nice little update on that. Normally the ADX calculations are calculated with the moving average "Running Moving Average (RMA)". Under the settings you can now select different MA types via the option "Type of Moving Average". With this new, interesting possibilities are then available.Selectable MA variants:
"COVWMA", "DEMA", "EMA", "EHMA", "FRAMA", "HMA", "KAMA", "RMA", "SMA", "SMMA", "VIDYA", "VWMA", "WMA"
發行說明
- Convert to PineScript5
發行說明
- add Style Options
- add new MA Types => "TEMA" (Triple EMA), "Karobein"
發行說明
- Refactor Code
開源腳本
本著TradingView的真正精神,此腳本的創建者將其開源,以便交易者可以查看和驗證其功能。向作者致敬!雖然您可以免費使用它,但請記住,重新發佈程式碼必須遵守我們的網站規則。
My published Scripts:
de.tradingview.com/u/KINSKI/
Appreciation of my work: paypal.com/paypalme/steffenhollstein
de.tradingview.com/u/KINSKI/
Appreciation of my work: paypal.com/paypalme/steffenhollstein
免責聲明
這些資訊和出版物並不意味著也不構成TradingView提供或認可的金融、投資、交易或其他類型的意見或建議。請在使用條款閱讀更多資訊。