OPEN-SOURCE SCRIPT
RSI Call-outs Multi-resolution [BigBitsIO]
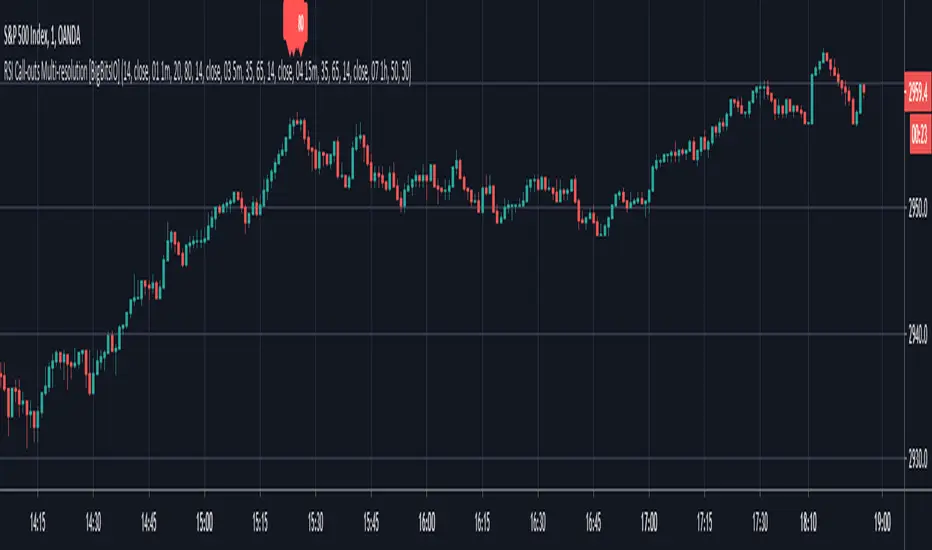
This is a simple multi-resolution (multi-timeframe) RSI indicator that overlays the current chart to show labels for specified oversold and overbought areas defined with inputs.
Up to 4 different resolutions/timeframes for their respective RSI (1,2,3, or 4). RSI1 is always enabled and can not be disabled.
Red labels with white text represent overbought RSI levels as defined by the user. All enabled RSI will have to qualify as overbought based on settings.
Green labels with black test represent oversold RSI levels as defined by the user. All enabled RSI will have to qualify as oversold based on settings.
This RSI overlay help easily call-out overbought and oversold candles on a chart where other RSI values on larger resolutions/timeframes are also oversold/overbought without sacrificing screen space for a traditional RSI indicator that is not overlayed on the chart.
This indicator has alert conditions that will trigger when all enabled RSI indicators are either oversold or overbought respective to your settings.
Note: The best results are to operate your chart as your smallest RSI resolution selected. Personally, I prefer to have my smallest (shortest timeframe) in RSI1, and go larger farther out to RSI4.
開源腳本
本著TradingView的真正精神,此腳本的創建者將其開源,以便交易者可以查看和驗證其功能。向作者致敬!雖然您可以免費使用它,但請記住,重新發佈程式碼必須遵守我們的網站規則。
免責聲明
這些資訊和出版物並不意味著也不構成TradingView提供或認可的金融、投資、交易或其他類型的意見或建議。請在使用條款閱讀更多資訊。
開源腳本
本著TradingView的真正精神,此腳本的創建者將其開源,以便交易者可以查看和驗證其功能。向作者致敬!雖然您可以免費使用它,但請記住,重新發佈程式碼必須遵守我們的網站規則。
免責聲明
這些資訊和出版物並不意味著也不構成TradingView提供或認可的金融、投資、交易或其他類型的意見或建議。請在使用條款閱讀更多資訊。