INVITE-ONLY SCRIPT
3D Trailing Stop
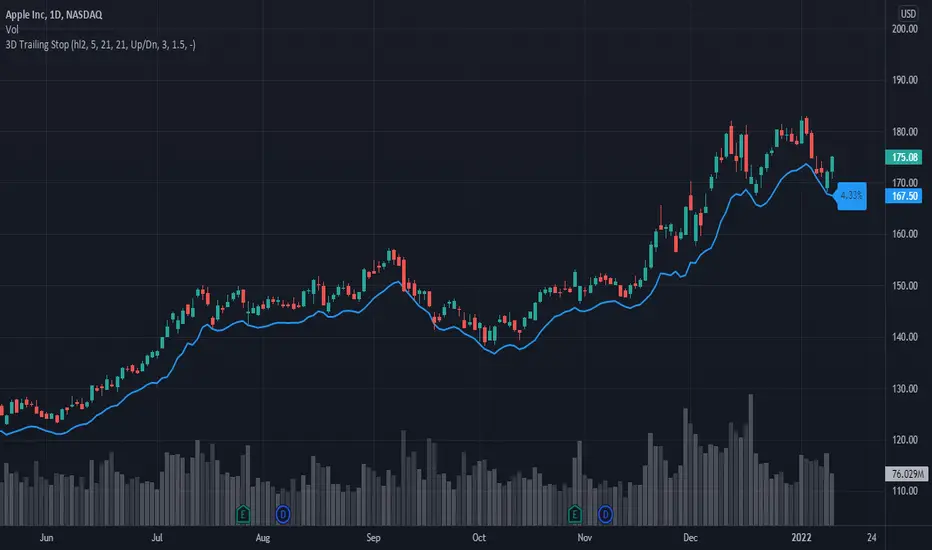
3D Trailing Stop is an indicator designed to keep you in trend trades and let you know when it may be a good time to exit. It's calculation is based on the Trend, Volatility and Volume pattern of the instrument. Instead of most trailing stops which are based on 1 measurement, it's based on 3 measurements, hence it's name 3D Trailing Stop, which is short for 3-Dimensional.
For example when looking at a long-only trade, the more up days and the more volume on those up days, the wider the trailing stop will be. However when the trend changes, and there's more down days with more volume then the trailing stop will tighten. The idea is to try and keep us in good trends for longer and get out of reversing trends earlier.
The default distance the trailing stop will be from the EMA (5) is always a multiple of 1.5 - 3x the ATR (21) and all of these settings are changeable by the user. To change the trailing stop from the default long trend to short trend change the ATR Offset setting from - to +. If you wish to display both a long and short trailing stop, simply add the indicator again to your chart with the ATR Offset + setting enabled. The indicator also shows how far the trailing stop price is from the last price, expressed as a % on the chart so you can easily see how far away the trailing stop is.
There are a few ways it can be used, for example one may wish to enter on a 50 or 100 bar high/low breakout and use the 3D Trailing Stop as a indicator when to get out of the trade. You could exit once price goes below the trailing stop, or use the previous bar trailing stop value as the level for a quicker exit.
This indicator can be used on any market and any timeframe, for both long and short trades. We have found it to work best on stocks long-only using the daily timeframe as stocks tend to have good up-trends over time. You could also use it on smaller timeframes in conjunction with other indicators and signals to enhance your win rate.
To get access PM or email me to my address shown below.
Enjoy :)
Disclaimer: All my scripts and content are for educational purposes only. I'm not a financial advisor and do not give personal finance advice. Past performance is no guarantee of future performance. Please trade at your own risk.
僅限邀請腳本
只有經作者授權的使用者才能訪問此腳本,且通常需付費。您可以將此腳本加入收藏,但需先向作者申請並獲得許可後才能使用 — 點擊此處了解更多。如需更多詳情,請依照作者說明或直接聯繫Click-Capital。
除非您完全信任其作者並了解腳本的工作原理,否則TradingView不建議您付費或使用腳本。您也可以在我們的社群腳本中找到免費的開源替代方案。
作者的說明
Contact me using TradingView private chat or email me at scale@greenstonedigital.com to request access to my invite-only scripts.
提醒:在請求訪問權限之前,請閱讀僅限邀請腳本指南。
免責聲明
這些資訊和出版物並不意味著也不構成TradingView提供或認可的金融、投資、交易或其他類型的意見或建議。請在使用條款閱讀更多資訊。