OPEN-SOURCE SCRIPT
Indicator: Derivative Oscillator
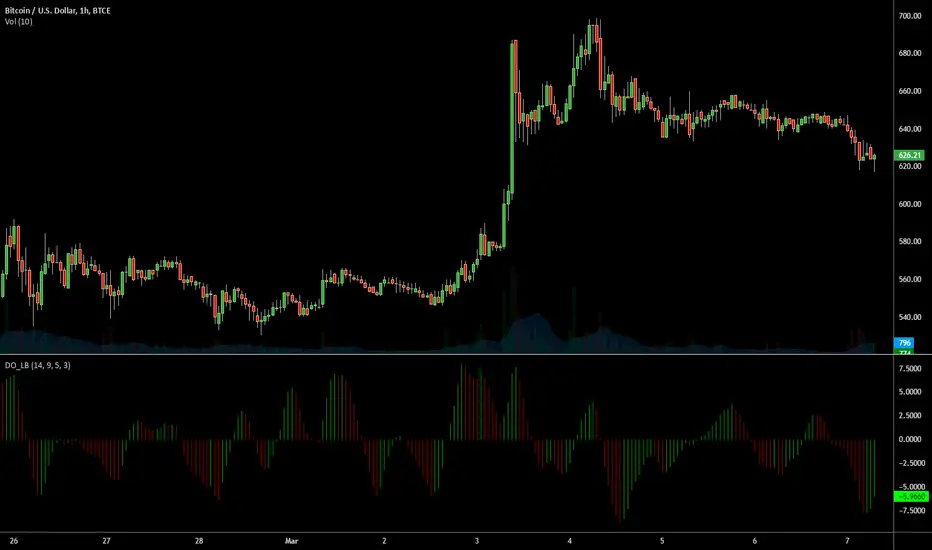
Constance Brown's Derivative Oscillator was published in her book "Technical Analysis for the Trading Professional".
The oscillator uses a 14-period RSI. The RSI is then double smoothed with exponential moving averages. The default settings for the smoothing periods are 5 and 3.
In a second step a signal line is generated from the smoothed RSI by calculating a simple moving average with a period of 9.
The Derivative Oscillator is calculated as the difference between the smoothed RSI and the signal line and displayed as histogram.
All the values are configurable.
開源腳本
本著TradingView的真正精神,此腳本的創建者將其開源,以便交易者可以查看和驗證其功能。向作者致敬!雖然您可以免費使用它,但請記住,重新發佈程式碼必須遵守我們的網站規則。
List of my free indicators: bit.ly/1LQaPK8
List of my indicators at Appstore: blog.tradingview.com/?p=970
List of my indicators at Appstore: blog.tradingview.com/?p=970
免責聲明
這些資訊和出版物並不意味著也不構成TradingView提供或認可的金融、投資、交易或其他類型的意見或建議。請在使用條款閱讀更多資訊。