INVITE-ONLY SCRIPT
已更新 MTF Dots Cor[Intromoto]
Hey traders.
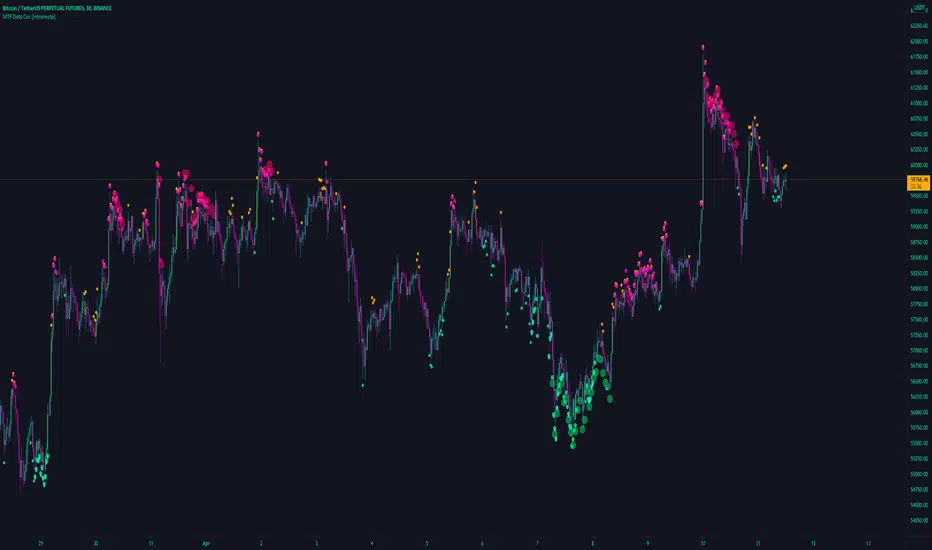
This indicator shows an MTF RSI levels via the dots above and below candles of a separate security. For example, type BTCUSDT into the ticker field and your chart will show the respective RSI levels for BTDUSDT, independent of your observed chart. This essentially shows RSI correlation to another asset.
There is also an MTF function in the settings to show the timeframe for the RSI oversold/overbought conditions.
DM for access.
發行說明
Fixed typosDM for access.
Follow on Twitter for updates.
One time fee, no subscription
twitter.com/IntroMoto
Follow on Twitter for updates.
One time fee, no subscription
twitter.com/IntroMoto
免責聲明
這些資訊和出版物並非旨在提供,也不構成TradingView提供或認可的任何形式的財務、投資、交易或其他類型的建議或推薦。請閱讀使用條款以了解更多資訊。
DM for access.
Follow on Twitter for updates.
One time fee, no subscription
twitter.com/IntroMoto
Follow on Twitter for updates.
One time fee, no subscription
twitter.com/IntroMoto
免責聲明
這些資訊和出版物並非旨在提供,也不構成TradingView提供或認可的任何形式的財務、投資、交易或其他類型的建議或推薦。請閱讀使用條款以了解更多資訊。