INVITE-ONLY SCRIPT
已更新 DepthHouse - ATR Fib Clouds
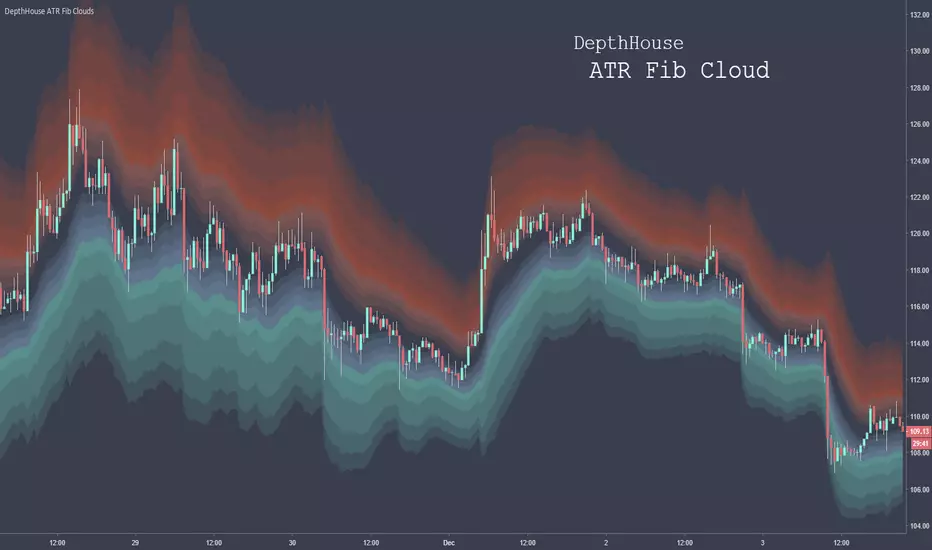
Depth House ATR Fib Clouds is used to help traders spot dynamic support, resistance, retracement zones, and over-extensions.
Here is a video which I give a brief overview and show it in action:
youtu.be/jrHsY29_Igc
Based on the zoning colors above:
Red and Blue zones represent common retracement zones.
Green and Orange zones represent possible over-extension zones, and trend changes.
This tool can also help differentiate between bull and bear markets on larger time frames. Trending markets tend to stick within the bottom or top of the loud zones.
Please Note: There are NOT trading signals. Each colored candle represents nothing other than a possibility of which way the trend may go. Be sure to use your own adequate analysis. Use at your own financial risk.
How to get:
As you can see this is an invite only script. In the coming months this indicator, along with many others will become pay to use only. (website on my profile page)
However all my indicators will be FREE until May 1, 2018. So please try them out!
To take advantage of this FREE trial:
1. Subscribe to my YouTube channel. I have many more videos to come! Maybe even leave a comment of what you would like to see next!
2. Comment on this indicator post! Maybe even give me a follow :D
I hope you all enjoy!!
Indicator website: depthhouse.com/
發行說明
updated default colors Creator of DepthHouse Indicators on TradingView!
↣ depthhouse.com/
↣ depthhouse.com/
免責聲明
這些資訊和出版物並不意味著也不構成TradingView提供或認可的金融、投資、交易或其他類型的意見或建議。請在使用條款閱讀更多資訊。
Creator of DepthHouse Indicators on TradingView!
↣ depthhouse.com/
↣ depthhouse.com/
免責聲明
這些資訊和出版物並不意味著也不構成TradingView提供或認可的金融、投資、交易或其他類型的意見或建議。請在使用條款閱讀更多資訊。