OPEN-SOURCE SCRIPT
已更新 [MAD] Fibchannels
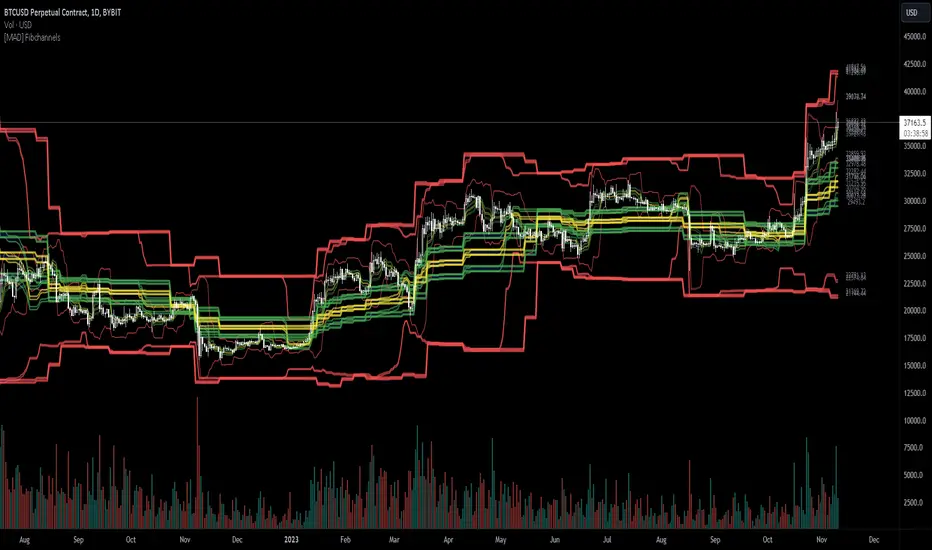
This is an indicator that gives you bands around the Fibonacci levels High/Low of the asset.
There are 3 time frames available so you can use the hourly, daily and weekly at the same time.
You can change the bands via selectable inputs to suit your own preferences.
you can as example combine with RSI or MACD to find a entry
There are 3 time frames available so you can use the hourly, daily and weekly at the same time.
You can change the bands via selectable inputs to suit your own preferences.
you can as example combine with RSI or MACD to find a entry
發行說明
Added labels and reduction of the securitycalls發行說明
Bug fixing and some small features:Colors
Transparency for Lines (per Timeframe)
Thickness for Lines (per Timeframe)
Fills configuration is because of lacking more plots still on manual selection
開源腳本
秉持TradingView一貫精神,這個腳本的創作者將其設為開源,以便交易者檢視並驗證其功能。向作者致敬!您可以免費使用此腳本,但請注意,重新發佈代碼需遵守我們的社群規範。
telegram - @djmad_0815
免責聲明
這些資訊和出版物並非旨在提供,也不構成TradingView提供或認可的任何形式的財務、投資、交易或其他類型的建議或推薦。請閱讀使用條款以了解更多資訊。
開源腳本
秉持TradingView一貫精神,這個腳本的創作者將其設為開源,以便交易者檢視並驗證其功能。向作者致敬!您可以免費使用此腳本,但請注意,重新發佈代碼需遵守我們的社群規範。
telegram - @djmad_0815
免責聲明
這些資訊和出版物並非旨在提供,也不構成TradingView提供或認可的任何形式的財務、投資、交易或其他類型的建議或推薦。請閱讀使用條款以了解更多資訊。