INVITE-ONLY SCRIPT
Wyckoff Wave Volume
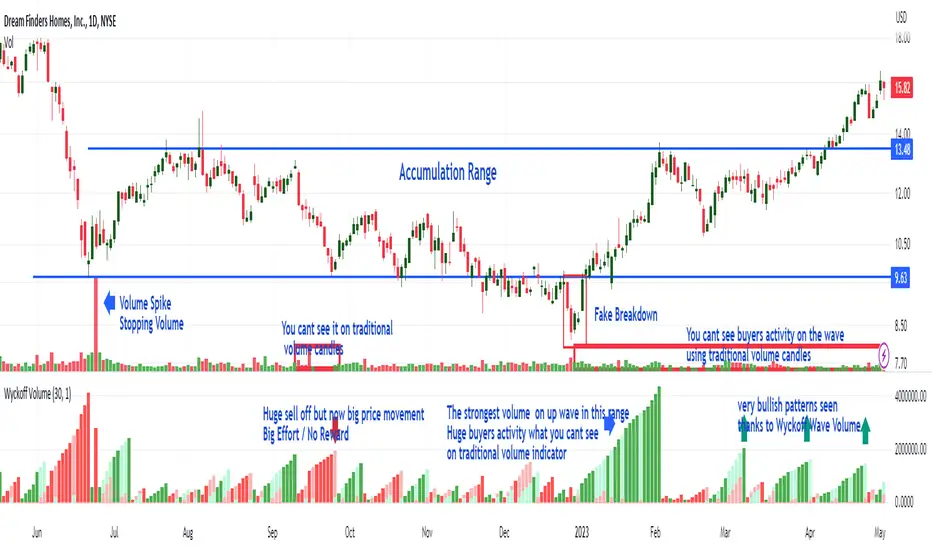
https://www.tradingview.com/x/dTqh3YCp/
What Is Wyckoff Wave Volume and How Does It Work?
It is the cumulative sum of exchanged (sold/bought) shares or contracts on a given wave (downward or upward) in a given time plotted below the chart as volume histogram. It shows how much trade is taking place on a given wave. Values are displayed below the chart as opposed to the Wyckoff Wave Chart indicator which displays these values as numbers plotted on the chart.
As you can see in the attached chart, volume candles usually only show a single buyer and seller exposure on the chart. On a normal volume, "Volume Spike" are clearly visible, which play an important role in the analysis. However, the cumulative volume on a wave gives us much more information and shows exactly on which waves the biggest purchases or the biggest sales take place. As in the attached chart, we can see how buyers aggressively carried out the final accumulation action just before the range breakout. In the analysis of the Wyckoff method, cumulative volume is a key indicator to assess the strength or weakness of the market.
It works very similarly the other way around (distribution). Before the market changes direction after large increases, downward waves are characterized by very high volume, which is drawn on the histogram as ultra-high bars. This is information about the distribution carried out by the players - taking profits after increases or opening shorts.
Wyckoff Wave Volume for TradingView
Wyckoff Wave Volume is the best tool to identify turning points in all markets. Money plays in the market, not set ups. Therefore, in order to earn money, you must play in the same direction as the professionals! It is thanks to the observation of the volume that you can know which side the professionals (Smart Money) are on and trade in accordance with their direction. You can also "look" inside the chart and see on the numbers or graphical histogram who controls the market at a given moment - Buyer or the Seller.
Let's Start From The Beginning!
Wyckoff Wave Volume created by Richard Wyckoff in early 1930' were a breakthrough in technical analysis. In his famous technical analysis course, he told his students to "think like waves". Volume analysis was an integral part of his way of investing. During the period when Wyckoff was active in the financial markets wave volume was calculated manually, we now have a fully automated version for TradingView. Using Wyckoff Cumulative Volume you will be surprised how well it identifies turning points in all markets and on any time frame. This tool is very helpful in predicting trend changes in all markets like forex, crypto, futures and stocks.
In order for the indicator to work well on all charts, it is necessary to set the appropriate step in its settings.
"Step" is the wave setting to be taken into account when counting the volume on a given swing. The standard setting for each round is 30. This is the measure of pips on which the next upward or downward wave is to be counted. However, for individual assets, these settings can be adjusted individually.
僅限邀請腳本
僅作者批准的使用者才能訪問此腳本。您需要申請並獲得使用許可,通常需在付款後才能取得。更多詳情,請依照作者以下的指示操作,或直接聯絡VolumeDayTrader。
TradingView不建議在未完全信任作者並了解其運作方式的情況下購買或使用腳本。您也可以在我們的社群腳本中找到免費的開源替代方案。
作者的說明
VolumeDayTrader offers professional indicators that measure volume on swings. It is the cumulative value of the volume on given swings necessary in market assessment. The indicator helps to identify turning points on the chart with greater precision
👉👉 Get Free US Stock Market PTA Signals
👉👉 Get Wyckoff Wave Chart Indicators
🌎 Free materials 👉👉 volumedaytrader.com
✳️ Free Signals & Technical Charts: t.me/volumedaytrader
support@volumedaytrader.com
👉👉 Get Wyckoff Wave Chart Indicators
🌎 Free materials 👉👉 volumedaytrader.com
✳️ Free Signals & Technical Charts: t.me/volumedaytrader
support@volumedaytrader.com
免責聲明
這些資訊和出版物並非旨在提供,也不構成TradingView提供或認可的任何形式的財務、投資、交易或其他類型的建議或推薦。請閱讀使用條款以了解更多資訊。