PROTECTED SOURCE SCRIPT
已更新 TMA - Divergence Indicator
█ OVERVIEW
This indicator was inspired by Arty and Christy. I have taken what they teach and combined it into this amazing RSI Divergence Oscillator.
█ COMPONENTS
Here is a brief overview of the indicator:
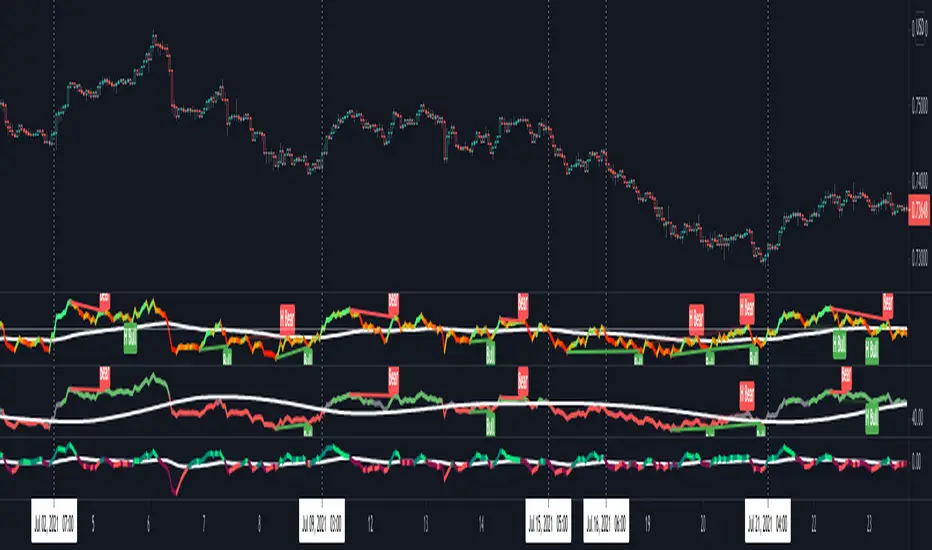
1 — RSI Divergence
Arty uses the RSI divergence as a tool to find entry points and possible reversals. He doesn't use the traditional overbought/oversold. He uses a 50 line. This indicator includes a 50 line and a floating 50 line.
The floating 50 line is a multi-timeframe smoothed moving average. Price is not linear, therefore, your 50 line shouldn't be either.
The RSI line is using a dynamic color algo that shows current control of the market as well as possible turning points in the market. Think of it as a momentum indicator inside your momentum indicator, pretty cool, huh?
2 — Smoothed RSI Divergence
The Smoothed RSI Divergence is a slower RSI with different calculations to smooth out the RSI line. This gives a different perspective of price action and more of a long term perspective of the trend. When crosses of the floating 50 line up with the traditional RSI crossing floating 50, these are amazing entries!
3 — Momentum Divergence
This is my baby. This one will take a little bit of time to master, (and I will be doing videos for you). But, once you master this, and combined with the other two, damn these entries get downright lethal!
This indicator was inspired by Arty and Christy. I have taken what they teach and combined it into this amazing RSI Divergence Oscillator.
█ COMPONENTS
Here is a brief overview of the indicator:
1 — RSI Divergence
Arty uses the RSI divergence as a tool to find entry points and possible reversals. He doesn't use the traditional overbought/oversold. He uses a 50 line. This indicator includes a 50 line and a floating 50 line.
The floating 50 line is a multi-timeframe smoothed moving average. Price is not linear, therefore, your 50 line shouldn't be either.
The RSI line is using a dynamic color algo that shows current control of the market as well as possible turning points in the market. Think of it as a momentum indicator inside your momentum indicator, pretty cool, huh?
2 — Smoothed RSI Divergence
The Smoothed RSI Divergence is a slower RSI with different calculations to smooth out the RSI line. This gives a different perspective of price action and more of a long term perspective of the trend. When crosses of the floating 50 line up with the traditional RSI crossing floating 50, these are amazing entries!
3 — Momentum Divergence
This is my baby. This one will take a little bit of time to master, (and I will be doing videos for you). But, once you master this, and combined with the other two, damn these entries get downright lethal!
發行說明
Updated chart to show price action發行說明
Small fix發行說明
Small code adjustments發行說明
Minor fixes1 - Added extreme levels (OB/OS)
2 - Preview of alerts to come
發行說明
Added Disclaimer1 — Added alerts for divergences
3 — Added alerts for floating 50 cross over and cross under
發行說明
Small code tweak受保護腳本
此腳本以閉源形式發佈。 不過,您可以自由且不受任何限制地使用它 — 在此處了解更多資訊。
免責聲明
這些資訊和出版物並不意味著也不構成TradingView提供或認可的金融、投資、交易或其他類型的意見或建議。請在使用條款閱讀更多資訊。
受保護腳本
此腳本以閉源形式發佈。 不過,您可以自由且不受任何限制地使用它 — 在此處了解更多資訊。
免責聲明
這些資訊和出版物並不意味著也不構成TradingView提供或認可的金融、投資、交易或其他類型的意見或建議。請在使用條款閱讀更多資訊。