INVITE-ONLY SCRIPT
Trends
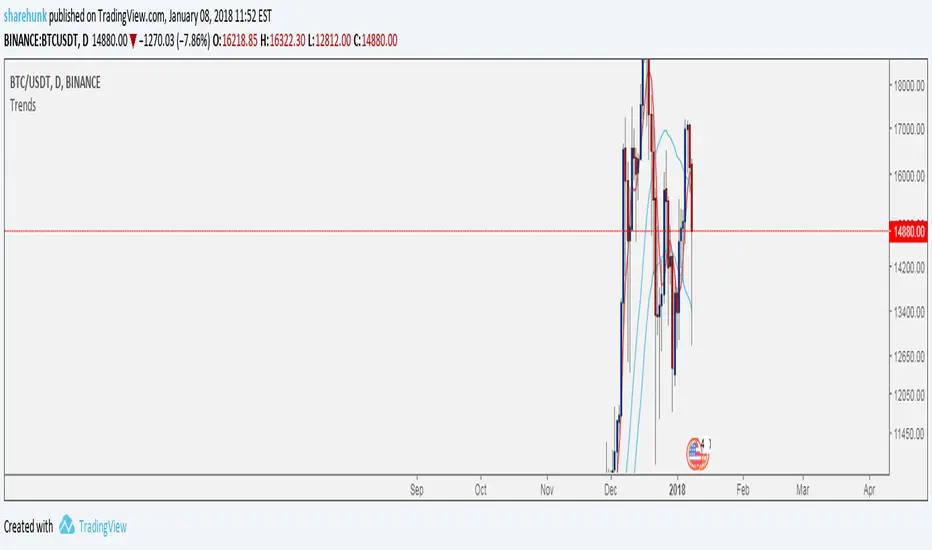
This chart will allow users to have a guide line for trading any markets by utilizing the below strategy.
a) For an up trending market [ Price is above the RED line and the RED line is above the two BLUE lines ]
A good BUY is when price reaches/drops near the RED line.
b) For a down trending market [ RED line is above the price and the two BLUE lines are above the RED line ]
A good SELL is when the price rises to the RED line.
Keeping it Simple !
Disclaimer : Trading involves risk, this script/strategy is not trading advise, rather it can act as a tool among others to gain confidence to enter a trade.
免責聲明
這些資訊和出版物並非旨在提供,也不構成TradingView提供或認可的任何形式的財務、投資、交易或其他類型的建議或推薦。請閱讀使用條款以了解更多資訊。