PROTECTED SOURCE SCRIPT
已更新 BarFlow Reversal [SiDec]
BarFlow Reversal is a powerful indicator designed to help traders spot momentum exhaustion and potential turning points using consecutive candle streaks. It tracks up- and down-runs, highlights key exhaustion counts (like 9, 11, 13, 15), and provides clean visual signals alongside an optional multi-timeframe dashboard — giving you a powerful, customisable momentum map right on your chart.
Overview
Main Components
1. Run Counters
2. Reversal Signals
➡️ An arrow plots when a streak of at least your Reversal Threshold is followed by:
➡️ Arrows come in three strengths (Weak, Strong, Max) based on the prior streak length and your predefined “strong” counts.
3. Bar Shading
4. Multi‑Timeframe Dashboard
5. Clean Label Management
Inputs at a Glance
Important Trading Note
BarFlow Reversal is not a standalone indicator.
It’s designed to be used in combination with other confluence factors — such as key support/resistance levels, supply/demand zones, VWAP, Fibonacci, liquidity zones, or your preferred price action setups.
While BarFlow Reversal can help you identify moments of exhaustion or likely reversals, it does not provide full trade signals on its own.
Make sure to combine it with proper confirmation tools and risk management before entering trades.
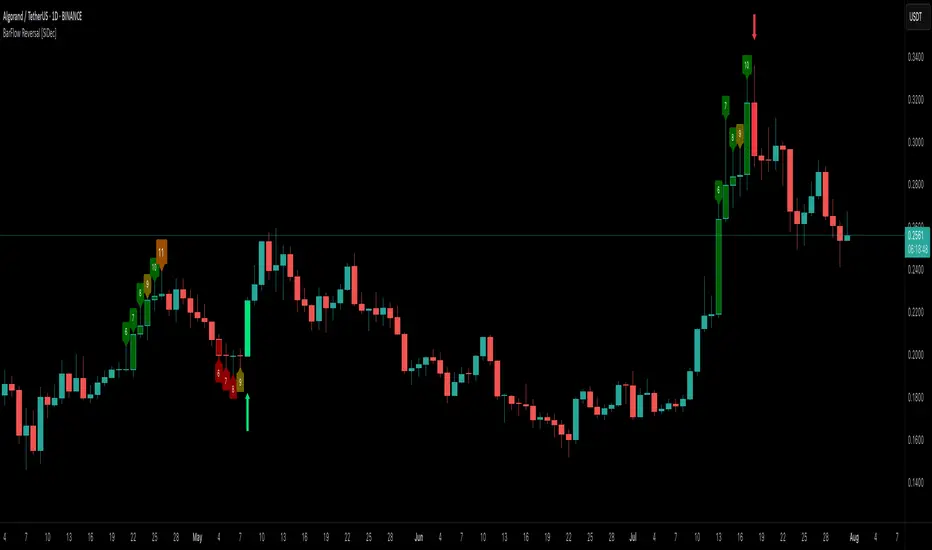
Here are some example screenshots of this indicator in action:


Quick Start
If you find it helpful, feel free to leave a like or comment and let me know how you use BarFlow Reversal in your own trading!
Happy trading! 📈
Overview
Main Components
1. Run Counters
- gCnt increments on up‑closes or dojis; rCnt increments on down‑closes or dojis.
- seqCount is the larger of those two, and only streaks at or above your Min Consecutive
- Special “strong” counts are emphasised with larger labels and unique colours.
2. Reversal Signals
➡️ An arrow plots when a streak of at least your Reversal Threshold is followed by:
- A candle closing opposite the streak
- Volume above a configurable multiple of its 25‑bar average
- ATR expanding
➡️ Arrows come in three strengths (Weak, Strong, Max) based on the prior streak length and your predefined “strong” counts.
3. Bar Shading
- Optionally tint each bar during an active run for instant visual feedback on trend direction and strength.
4. Multi‑Timeframe Dashboard
- Displays current vs. previous run counts on 1H, 4H, 12H, Daily, Weekly, and Monthly.
- Colour‑coded cells show direction and highlight special counts, so you can quickly assess broader momentum.
5. Clean Label Management
- Automatically removes outdated streak labels to keep your chart uncluttered.
- Labels are positioned just above or below bars and offset slightly to avoid overlap.
Inputs at a Glance
- Appearance: Choose Classic, Mono, or Manual theme; set Dark/Light background.
- Counting: Define minimum streak length, list of strong counts, and toggle bar shading.
- Trend & Filters: Adjust volume multiplier, reversal threshold, and enable/disable arrow plotting.
- Dashboard & Cleanup: Show or hide the multi‑timeframe table; auto‑clear old labels.
- Colours: Fully customise run labels, special counts, arrows, and dashboard.
Important Trading Note
BarFlow Reversal is not a standalone indicator.
It’s designed to be used in combination with other confluence factors — such as key support/resistance levels, supply/demand zones, VWAP, Fibonacci, liquidity zones, or your preferred price action setups.
While BarFlow Reversal can help you identify moments of exhaustion or likely reversals, it does not provide full trade signals on its own.
Make sure to combine it with proper confirmation tools and risk management before entering trades.
Here are some example screenshots of this indicator in action:
Quick Start
- Once you click “Add to favorites,” you’ll find BarFlow Reversal under Indicators for quick use on any chart.
- Tweak inputs to match your trading style: set streak lengths, arrow sensitivity, and colour themes.
- Watch as BarFlow Reversal highlights exhaustion points and reversal opportunities—across all your favorite timeframes.
If you find it helpful, feel free to leave a like or comment and let me know how you use BarFlow Reversal in your own trading!
Happy trading! 📈
發行說明
Updated Chart發行說明
Update — Centered Label Alignment→ Streak count labels are now perfectly center-aligned (text.align_center) to improve visual balance and readability.
→ Adjusted vertical placement with a slight offset so labels no longer overlap with candle bodies or wicks.
→ This ensures counts remain visually consistent regardless of number size or candle direction.
發行說明
UpdateA complete alert system added:
1. Reversal Alerts
- Buy Weak / Buy Strong / Buy Max
- Sell Weak / Sell Strong / Sell Max
2. Any-Reversal Alerts
- Buy Reversal — Any → triggers on any Buy (Weak/Strong/Max)
- Sell Reversal — Any → triggers on any Sell (Weak/Strong/Max)
3. Count Alerts (Optional)
- Alerts when streaks reach 9, 11, 13, 15 — separated into Up runs and Down runs.
4. Custom Messages
- Alert messages include {{ticker}} and {{close}} placeholders for TradingView alerts.
- Messages are descriptive so you know whether it’s Weak/Strong/Max or which count threshold was hit.
With this update, you can now automate your BarFlow signals into TradingView alerts, perfect for catching reversals or streak exhaustion in real time without watching the chart 24/7
受保護腳本
此腳本以閉源形式發佈。 不過,您可以自由使用,沒有任何限制 — 點擊此處了解更多。
🏆 Mastering Fibonacci for precision trading
🔹 Sharing high-probability trade setups
⚡ Unlock the power of technical analysis!
🔹 Sharing high-probability trade setups
⚡ Unlock the power of technical analysis!
免責聲明
這些資訊和出版物並非旨在提供,也不構成TradingView提供或認可的任何形式的財務、投資、交易或其他類型的建議或推薦。請閱讀使用條款以了解更多資訊。