PROTECTED SOURCE SCRIPT
已更新 sharp mpz
Identifying divergence (triple peaks and triple valleys) with RSI.
發行說明
Identifying divergence (triple peaks and triple valleys) with RSI.發行說明
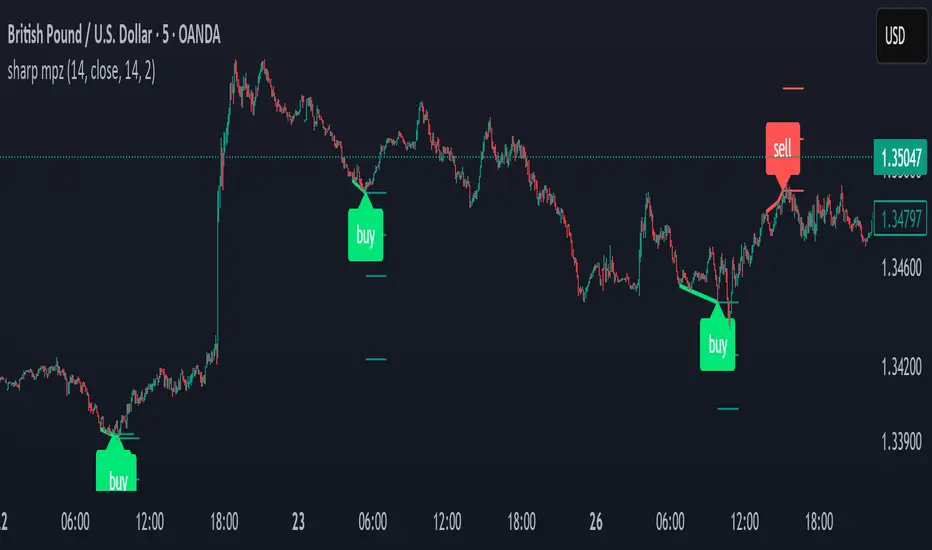
This indicator detects divergences. Specifically, it looks for a type of triple divergence between price and the Relative Strength Index (RSI) to issue buy or sell signals.By analyzing the relationship between price movement (high and low pivot points) and the RSI oscillator, this indicator seeks out trading opportunities. Its core logic is to find a specific pattern of three consecutive pivot points where the price is making higher highs (for a bearish signal) or lower lows (for a bullish signal), while the RSI is simultaneously forming lower highs or higher lows, respectively.
受保護腳本
此腳本以閉源形式發佈。 不過,您可以自由使用,沒有任何限制 — 點擊此處了解更多。
免責聲明
這些資訊和出版物並非旨在提供,也不構成TradingView提供或認可的任何形式的財務、投資、交易或其他類型的建議或推薦。請閱讀使用條款以了解更多資訊。
受保護腳本
此腳本以閉源形式發佈。 不過,您可以自由使用,沒有任何限制 — 點擊此處了解更多。
免責聲明
這些資訊和出版物並非旨在提供,也不構成TradingView提供或認可的任何形式的財務、投資、交易或其他類型的建議或推薦。請閱讀使用條款以了解更多資訊。