OPEN-SOURCE SCRIPT
RSI OverBought/Sold Price Predict
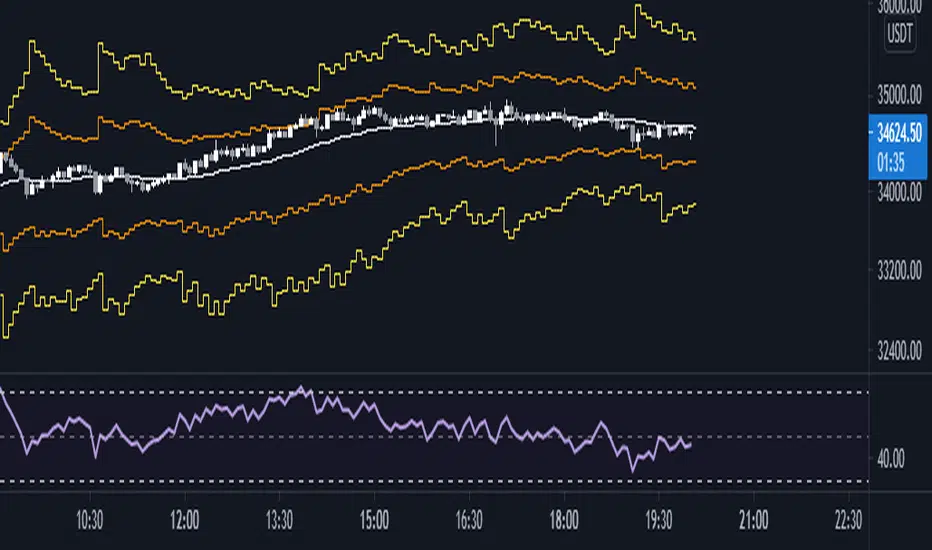
Using the RSI formula, predict what price should be next to be oversold or overbought.
For using support and resistance, turn on "smoothing" option.
White Line = what price should be next to be RSI = 50.
Orange Line = what price should be next to be RSI = 70 or 30 (Default)
Yellow Line = what price should be next to be RSI = 80 or 20 (Default)
Green Line = what price should be next to be RSI = 90 or 10 (Default)
開源腳本
秉持TradingView一貫精神,這個腳本的創作者將其設為開源,以便交易者檢視並驗證其功能。向作者致敬!您可以免費使用此腳本,但請注意,重新發佈代碼需遵守我們的社群規範。
免責聲明
這些資訊和出版物並非旨在提供,也不構成TradingView提供或認可的任何形式的財務、投資、交易或其他類型的建議或推薦。請閱讀使用條款以了解更多資訊。
開源腳本
秉持TradingView一貫精神,這個腳本的創作者將其設為開源,以便交易者檢視並驗證其功能。向作者致敬!您可以免費使用此腳本,但請注意,重新發佈代碼需遵守我們的社群規範。
免責聲明
這些資訊和出版物並非旨在提供,也不構成TradingView提供或認可的任何形式的財務、投資、交易或其他類型的建議或推薦。請閱讀使用條款以了解更多資訊。