OPEN-SOURCE SCRIPT
已更新 Bitcoin Risk Metric II
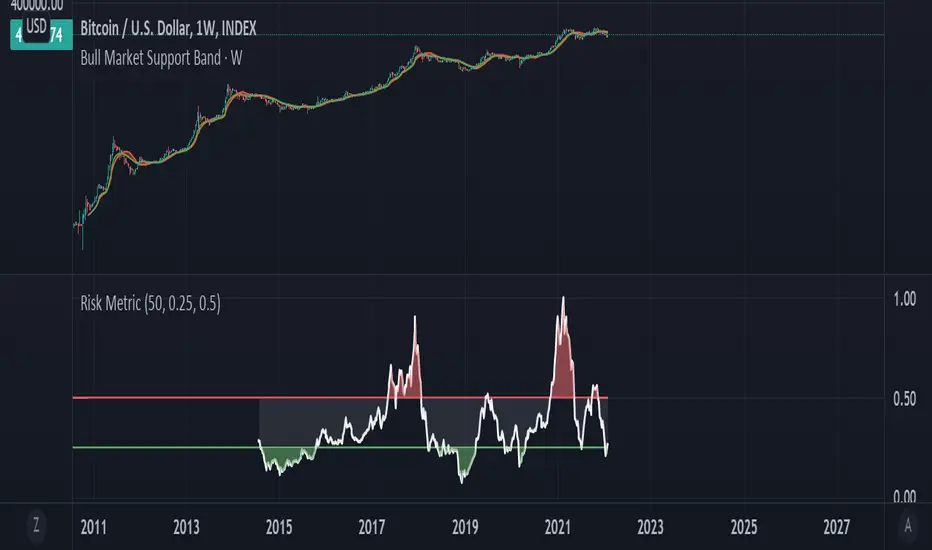
Thesis: Bitcoin's price movements can be (dubiously) characterized by functional relationships between moving averages and standard deviations. These movements can be normalized into a risk metric through normalization functions of time. This risk metric may be able to quantify a long term "buy low, sell high" strategy.
This risk metric is the average of three normalized metrics:
1. (btc - 4 yma)/ (std dev)
2. ln(btc / 20 wma)
3. (50 dma)/(50 wma)
* btc = btc price
* yma = yearly moving average of btc, wma = weekly moving average of btc, dma = daily moving average of btc
* std dev = std dev of btc
Important note:
Historical data for this metric is only shown back until 2014, because of the nature of the 1st mentioned metric. The other two metrics produce a value back until 2011. A previous, less robust, version of metric 2 is posted on my TradingView as well.
發行說明
Tidied up code. 開源腳本
秉持TradingView一貫精神,這個腳本的創作者將其設為開源,以便交易者檢視並驗證其功能。向作者致敬!您可以免費使用此腳本,但請注意,重新發佈代碼需遵守我們的社群規範。
免責聲明
這些資訊和出版物並非旨在提供,也不構成TradingView提供或認可的任何形式的財務、投資、交易或其他類型的建議或推薦。請閱讀使用條款以了解更多資訊。
開源腳本
秉持TradingView一貫精神,這個腳本的創作者將其設為開源,以便交易者檢視並驗證其功能。向作者致敬!您可以免費使用此腳本,但請注意,重新發佈代碼需遵守我們的社群規範。
免責聲明
這些資訊和出版物並非旨在提供,也不構成TradingView提供或認可的任何形式的財務、投資、交易或其他類型的建議或推薦。請閱讀使用條款以了解更多資訊。