PROTECTED SOURCE SCRIPT
已更新 BTC Market Top and Bottom
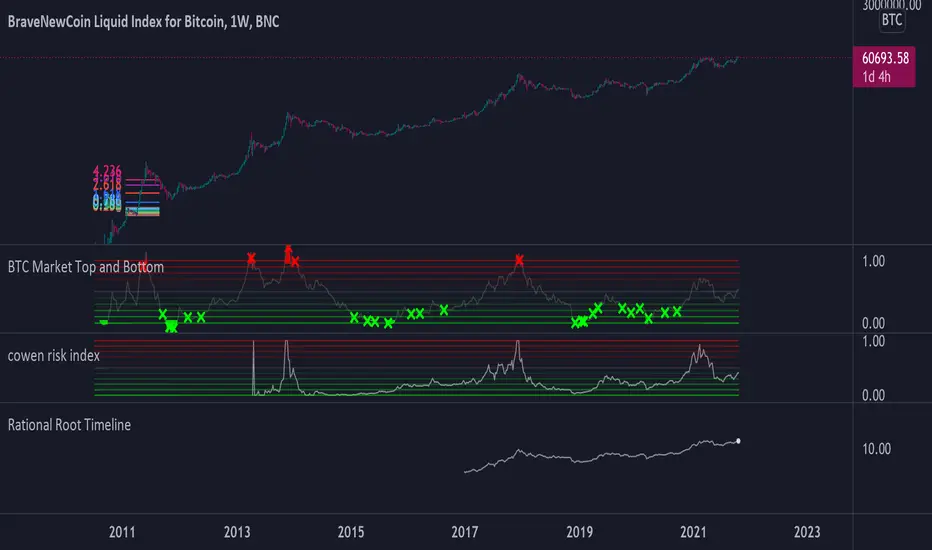
This script is a logarithmic moving average oscillator for the daily BTC chart (Or any asset ideally with data more than 4 years in length) to help find the top and bottom of the entire cycle. The idea is to buy when the oscillator is near green and sell when things are near the red. Should be used in conjunction with shorter timeframe indicators to find your best entries. This just shows the overall position of the cycle.
Instructions:
Use on a Daily BTCUSD chart or BLX chart. The more data the better.
Adjust the length to around 1000-1500 (this mainly controls the green line)
Adjust the denominator (this mainly controls the red line)
Adjust the smoothness (for visual appeal and noise reduction)
Instructions:
Use on a Daily BTCUSD chart or BLX chart. The more data the better.
Adjust the length to around 1000-1500 (this mainly controls the green line)
Adjust the denominator (this mainly controls the red line)
Adjust the smoothness (for visual appeal and noise reduction)
發行說明
Converted to security function to show Daily on all timeframes. Changed signal line to a function to allow for an incrementing sma inside the security function. 發行說明
Added a momentum function to the signal. This should help spot when the momentum is potentially reversing when the signal is higher than momentum top and less than momentum bottom. You can adjust them in the settings.發行說明
Added risk levels受保護腳本
此腳本以閉源形式發佈。 不過,您可以自由使用,沒有任何限制 — 點擊此處了解更多。
免責聲明
這些資訊和出版物並非旨在提供,也不構成TradingView提供或認可的任何形式的財務、投資、交易或其他類型的建議或推薦。請閱讀使用條款以了解更多資訊。
免責聲明
這些資訊和出版物並非旨在提供,也不構成TradingView提供或認可的任何形式的財務、投資、交易或其他類型的建議或推薦。請閱讀使用條款以了解更多資訊。