PROTECTED SOURCE SCRIPT
已更新 Timeframe Continuity
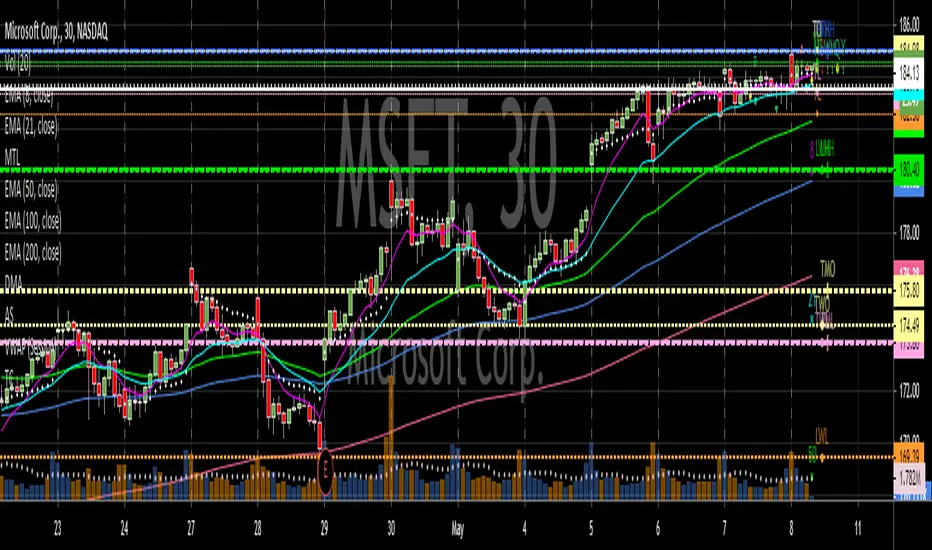
Based on Rob Smith from T3Live's "The Strat" system.
Places an indicator on the top right of the chart that shows if the current bar on the current or higher timeframe is red or green.
Allows the user to identify timeframe continuity or conflicting timeframes at a glance.
Not recommended for those who have not completed Rob's course.
Places an indicator on the top right of the chart that shows if the current bar on the current or higher timeframe is red or green.
Allows the user to identify timeframe continuity or conflicting timeframes at a glance.
Not recommended for those who have not completed Rob's course.
發行說明
Script will now draw a yellow circle behind the associated arrow if the current bar is inside.Indicator has also been moved to the bottom of the screen by default.
發行說明
Moved default location back to top.發行說明
A silver square will now display behind the associated red/green arrow if the current bar is outside.Changed location of bars to the right of the current bar to improve visibility.
This script is designed for those who view multiple symbols simultaneously and do not have the screen space to view all time frame charts at the same time.
The Strat
發行說明
No functionality changes. Corrected a naming issue in the settings menu.受保護腳本
此腳本以閉源形式發佈。 不過,您可以自由使用,沒有任何限制 — 點擊此處了解更多。
免責聲明
這些資訊和出版物並非旨在提供,也不構成TradingView提供或認可的任何形式的財務、投資、交易或其他類型的建議或推薦。請閱讀使用條款以了解更多資訊。
受保護腳本
此腳本以閉源形式發佈。 不過,您可以自由使用,沒有任何限制 — 點擊此處了解更多。
免責聲明
這些資訊和出版物並非旨在提供,也不構成TradingView提供或認可的任何形式的財務、投資、交易或其他類型的建議或推薦。請閱讀使用條款以了解更多資訊。