PROTECTED SOURCE SCRIPT
已更新 [_ParkF]KDJ
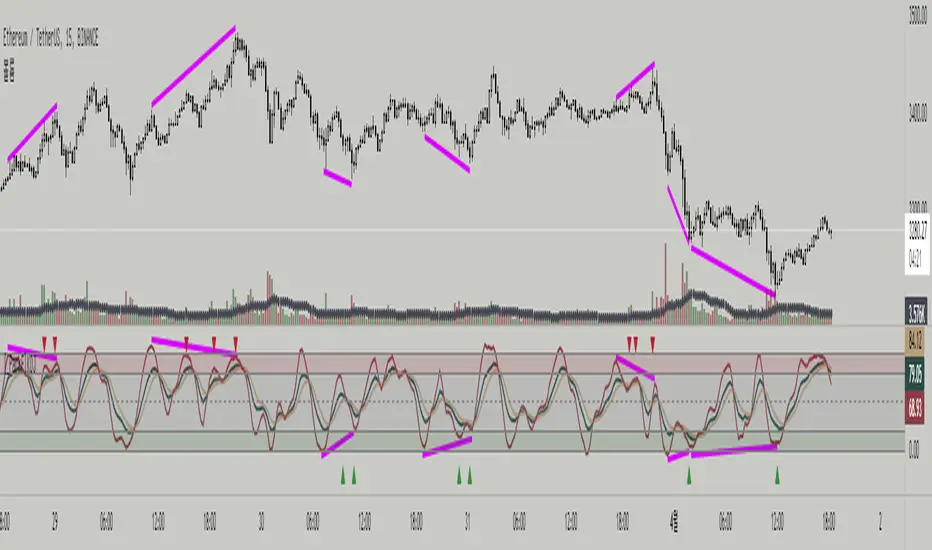
This indicator is based on price fluctuations.
It is a trend indicator that uses changes in K, D, and J values as a calculation formula.
Like my previous indicators, Divergence was included.
The movements of the K, D, and J lines are also shown through the histogram.
The Period value and color of each line can be modified.
The color of the histogram can also be modified.
I hope you will use this indicator differently from the usual one with overbuying and overselling sections.
We do not recommend entering the position when J Line enters the red area,
which is the over-buying section of this indicator, and the green area, which is the over-selling section.
Based on J Line's entry into overbuying and overselling areas,
it is recommended to watch future trends, check overlapping with divergence signals or RSI+ indicators
and determine with support and resistance in parallel channels or trend lines to increase reliability of position entry.
I hope it will help you with your trading.
hope you become rich!
-------------------------------------------------------------------------------------------------------------------------------------------------
이 지표는 가격 변동을 중심으로 한 지표입니다.
K, D, J 값의 변화를 계산식으로 사용하는 트렌드계 지표입니다.
기존의 제 지표와 마찬가지로 Divergence가 포함되었고
K, D, J 선의 움직임은 히스토그램을 통해서도 나타나게 됩니다.
각 선의 Period 값, 색상을 수정 가능하며
히스토그램의 색상 또한 수정이 가능 합니다.
이 지표는 과매수, 과매도 구간이 있는 일반적인 지표의 사용법과는 다르게 사용하셨으면 좋겠습니다.
과매수 구간인 빨간색 지역과 과매도 구간인 초록색 지역으로 J Line이 진입했을 때 포지션 진입을 하는 것은 추천 드리지 않습니다.
J Line이 과매수, 과매도 지역으로 진입했을 때를 기준으로 향후 추세를 지켜보고
다이버전스 신호 또는 제 지표인 RSI+ 지표와의 중복 확인,
선형회귀( parallel channel )나 추세선에서의 지지, 저항과 함께 판단하여 포지션 진입의 신뢰도를 높혀주는 형태로 사용하시길 권장 드립니다.
당신의 트레이딩에 도움이 되었으면 합니다.
부자되세요!
發行說明
Added Histogram and Histogram On / Off Switch發行說明
Added alert受保護腳本
此腳本以閉源形式發佈。 不過,您可以自由且不受任何限制地使用它 — 在此處了解更多資訊。
免責聲明
這些資訊和出版物並不意味著也不構成TradingView提供或認可的金融、投資、交易或其他類型的意見或建議。請在使用條款閱讀更多資訊。
免責聲明
這些資訊和出版物並不意味著也不構成TradingView提供或認可的金融、投資、交易或其他類型的意見或建議。請在使用條款閱讀更多資訊。