OPEN-SOURCE SCRIPT
已更新 Auto_Corr_Daily
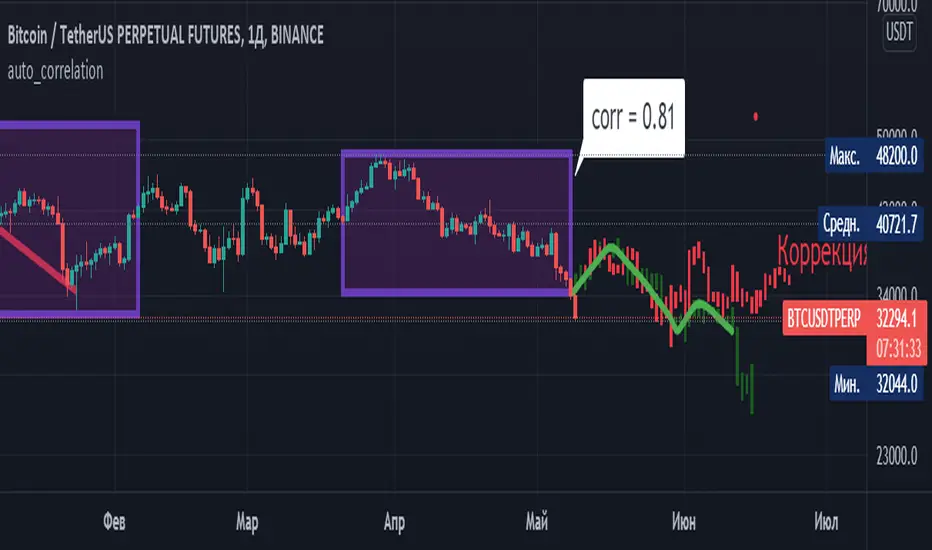
This indicator shows the Pearson correlation coefficient between different periods of one financial instrument. Two dates are set, which are the starting points of two series, between which the correlation coefficient is calculated. The correlation period is taken from the difference of the current date from the second reference point. The indicator is designed to analyze the correlation only on the 1D timeframe.
發行說明
можно ввести период анализа и параметр анализа開源腳本
本著TradingView的真正精神,此腳本的創建者將其開源,以便交易者可以查看和驗證其功能。向作者致敬!雖然您可以免費使用它,但請記住,重新發佈程式碼必須遵守我們的網站規則。
免責聲明
這些資訊和出版物並不意味著也不構成TradingView提供或認可的金融、投資、交易或其他類型的意見或建議。請在使用條款閱讀更多資訊。
開源腳本
本著TradingView的真正精神,此腳本的創建者將其開源,以便交易者可以查看和驗證其功能。向作者致敬!雖然您可以免費使用它,但請記住,重新發佈程式碼必須遵守我們的網站規則。
免責聲明
這些資訊和出版物並不意味著也不構成TradingView提供或認可的金融、投資、交易或其他類型的意見或建議。請在使用條款閱讀更多資訊。